

Budget basics: Your essential guide to the key numbers, in 18 charts
")
- From tax collections to capital expenditure, and welfare schemes to economic growth, here are 18 big numbers from the Union Budget 2024-25.

NEW DELHI : The Union Budget is an annual statement of where the central government plans to earn its revenues from and where it plans to spend. It contains several quantitative terms that are a recurring feature, capturing some key dimension of the government’s finances. Here are 18 numbers that matter in this annual statement of intent and here’s what Budget 2024 said about them.
Also read: Budget 2024: The math of how the Centre will cut its fiscal deficit, explained
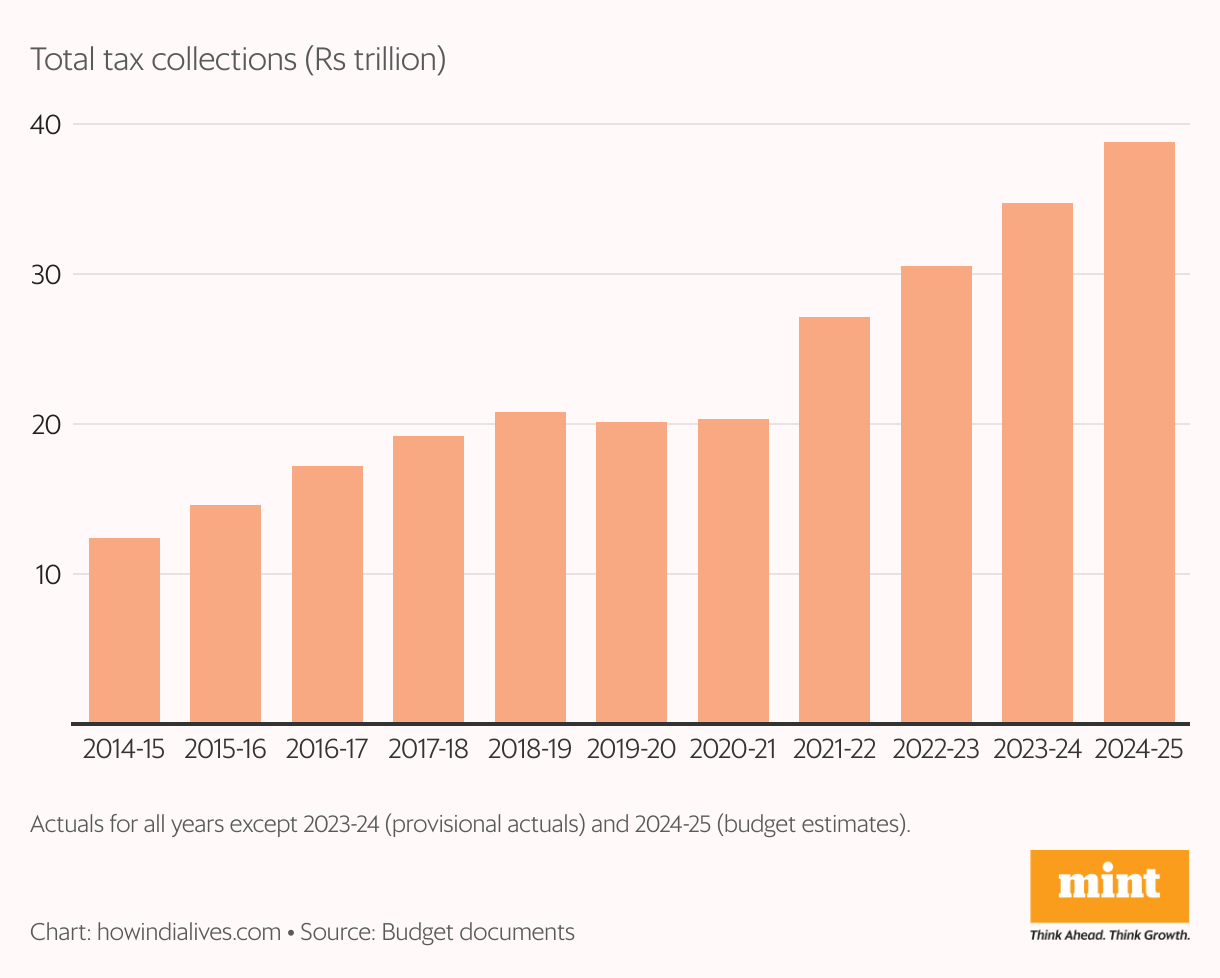
Total Tax Collections
Why does it matter?
Tax collections are the Centre’s main source of revenues. The more taxes it collects, the more it can spend. The total tax collected can be broken into two parts. The first is direct taxes, which is income tax paid by individuals and companies. The second is indirect taxes, which is principally the goods and services tax (GST).
What do the numbers say?
● Between 2017-18 and 2024-25, the share of GST and personal income tax in total revenues rose from 45% to 58.6%.
● However, the share of the Centre’s tax revenues as a share of gross domestic product (GDP) has remained flat, at 11-12%.
Key stat:
12.3%: Average annual growth rate in tax revenues between 2021-22 and 2024-25. This is up from 10.1% between 2014-15 and 2019-20.
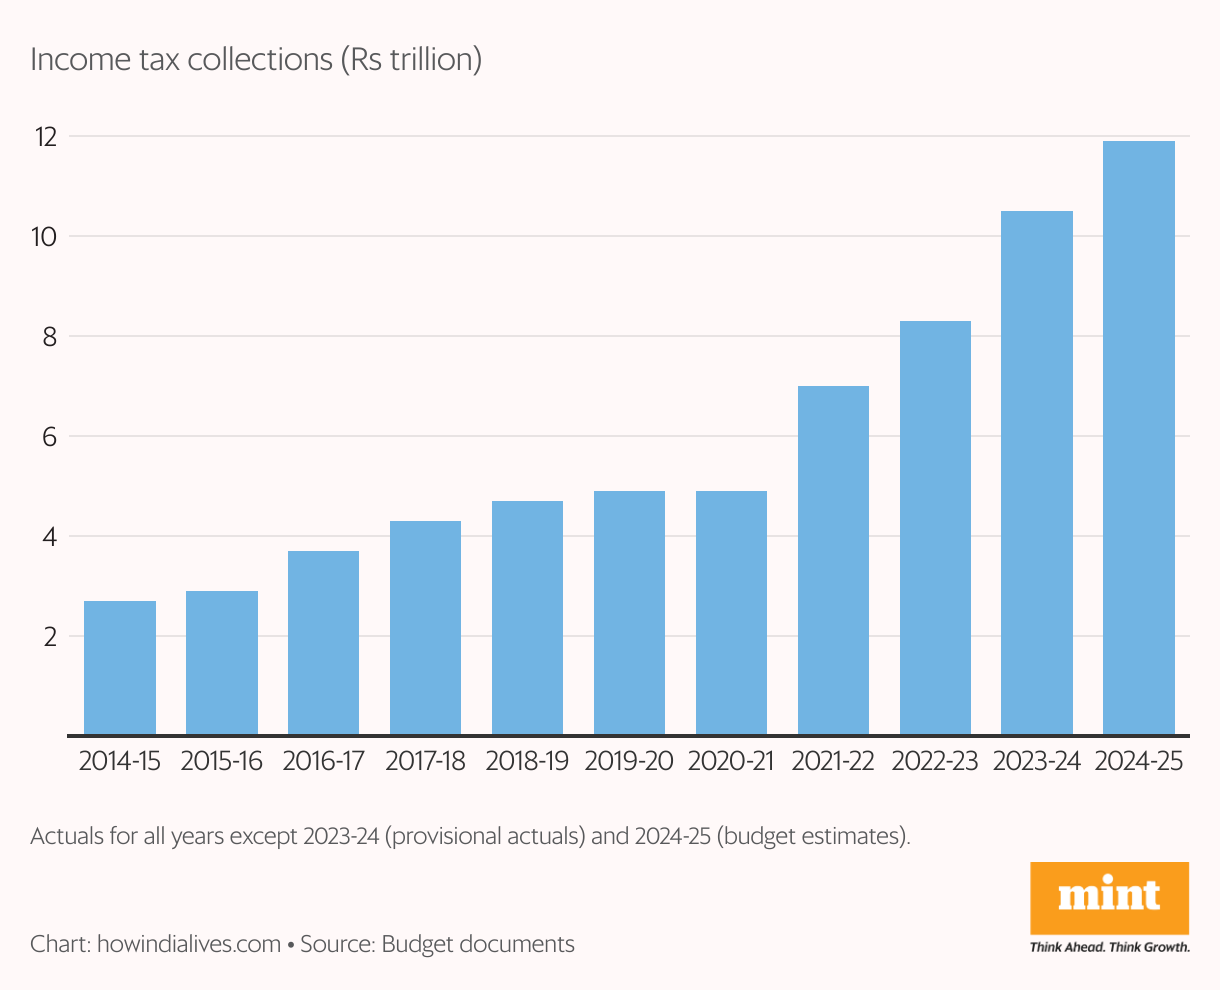
Income tax collections
Why does it matter?
This is what the government collects from individuals and organisations other than companies by way of taxing their income. Given that a focus of the government in its first budget after the election will be jobs and welfare, a key concern will be the need to find tax revenues to pay for an expansion of welfare schemes.
Also read: Income tax cuts in Budget are a half-hearted recipe to fix India’s consumption woes
What do the numbers say?
● One, a major shift that has happened in the post-covid era is that personal income taxes now account for more than 50% of direct taxes.
● Two, personal income taxes accounted for 52% of direct tax (corporation tax plus personal income tax) in 2023-24, against 39% in 2015-16.
Key stat:
3.6%: Personal income tax collections as a share of GDP in 2024-25.
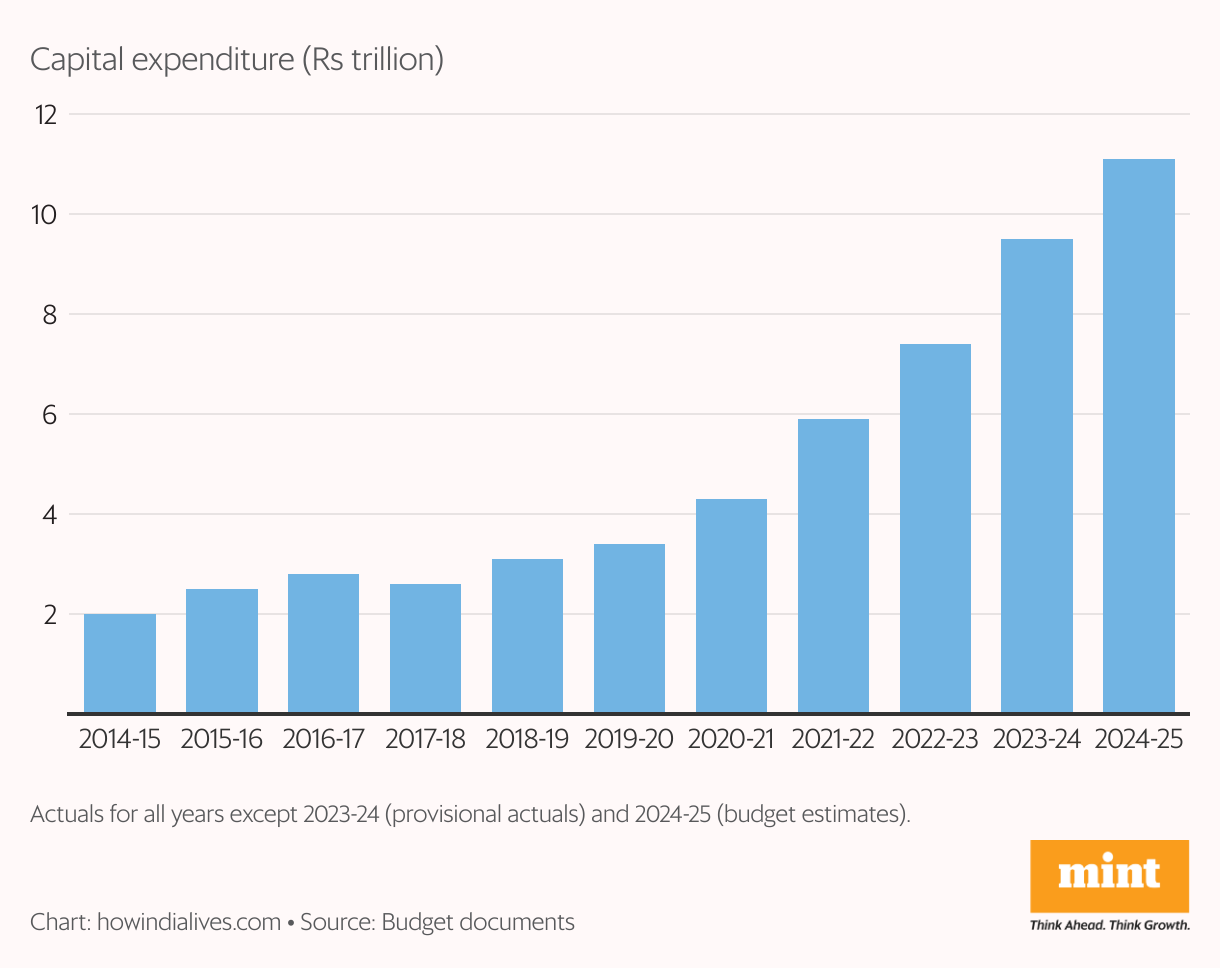
Capital Expenditure
Why does it matter?
Capital expenditure is spending of a desirable nature, as it has a multiplier effect in terms of building new assets, creating jobs and adding to economic output. This is as opposed to spending of a regular nature like paying salaries or upkeep of offices, which amounts to nearly 80-90% of the centre’s total spend. The objective is to increase capex.
What do the numbers say?
● Post-covid, capital expenditure by the Centre has trebled in five years. But it includes a large chunk of capex earlier done by public sector undertakings (PSUs).
● Overall, public sector capex, including that of government companies, actually fell from 4.9% of GDP in 2019-20 to 4.33% budgeted for 2024-25.
Key stat:
-0.7: The decrease in percentage points in public sector capex (Centre + PSUs) as a share of GDP in 2024-25, compared with 10 years ago.
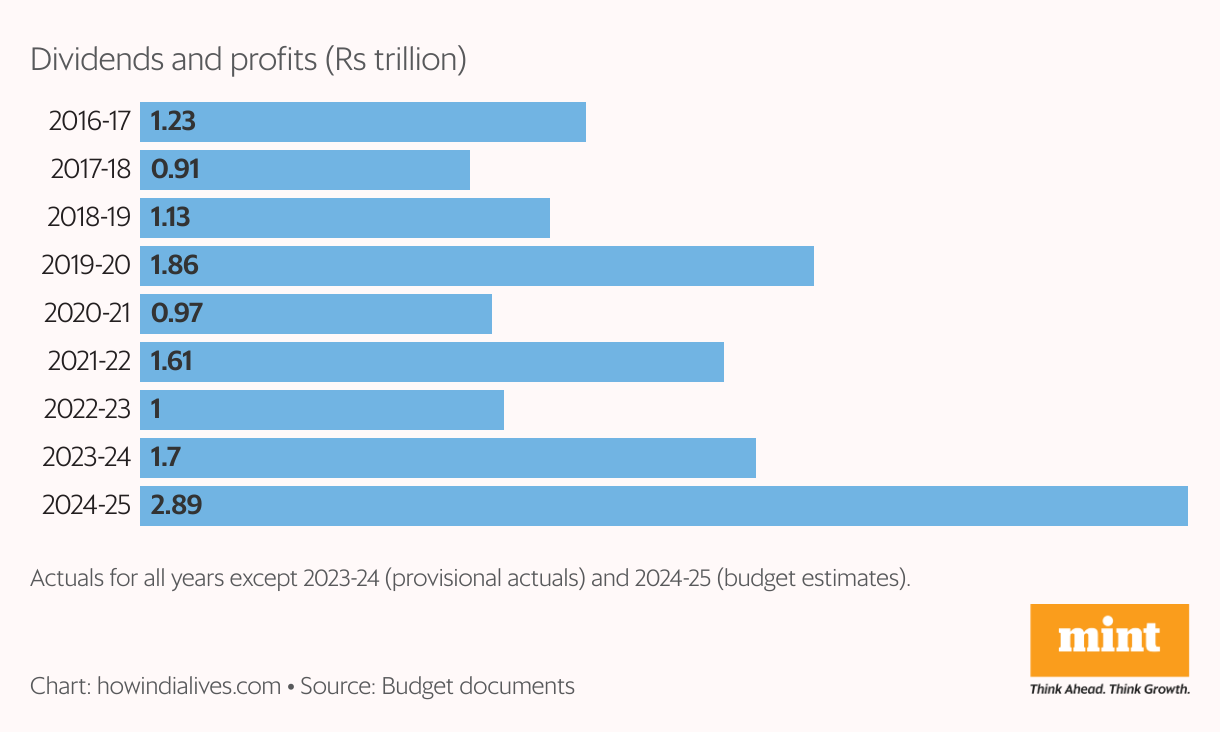
Dividends and Profits
Why does it matter?
These are the surpluses that the companies and institutions owned by the centre transfer to it. For the Centre, this is a relatively small source of revenue—about 9% of revenue receipts in 2024-25. The government will welcome additions under this head, as it is looking to expand spending on welfare schemes and employment generation.
What do the numbers say?
● After ups and downs, 2024-25 is a big year, with the central bank transferring ₹2.1 trillion this year as dividend.
● Thanks to the bumper central bank dividend, the estimated year-on-year increase in this head in 2024-25 is 70%.
Key stat
₹56,260 crore: Dividends budgeted to be transferred to the Centre from banks and non-financial public sector undertakings.
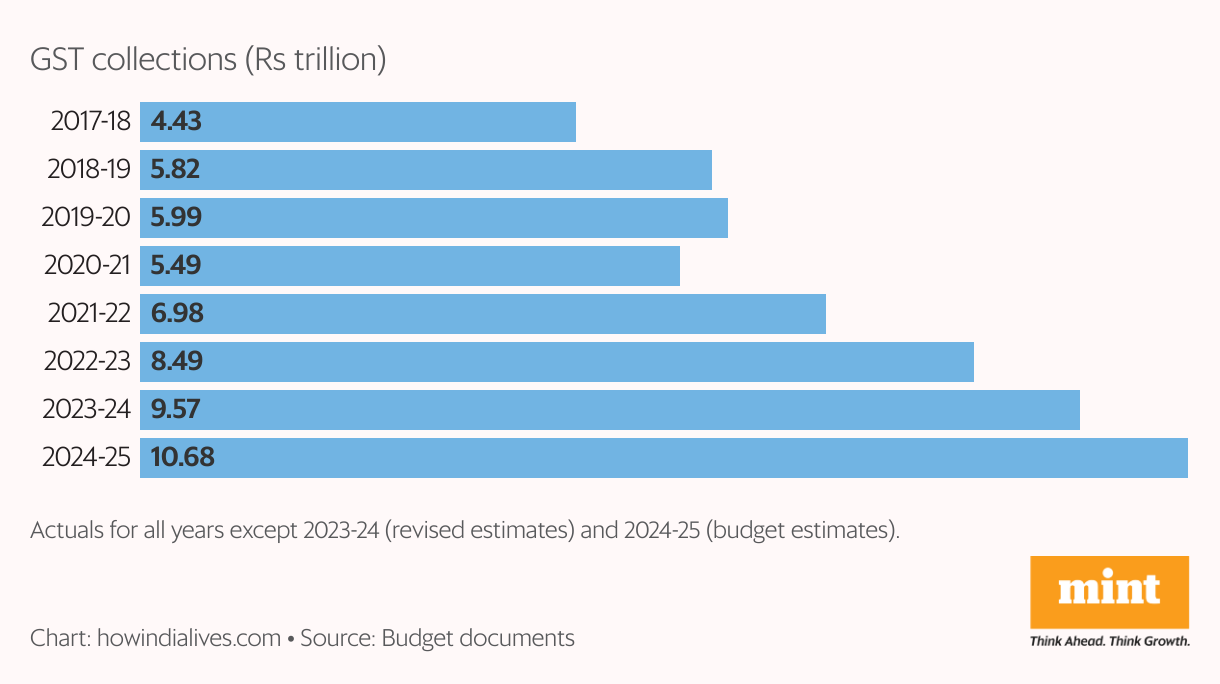
Goods and Services Tax (GST)
Why does it matter?
Introduced in July 2017, GST brought the taxation of goods and services under a single umbrella, replacing a raft of state and central taxes. The aim was to create a single common market. GST has become a mainstay of the government’s overall tax effort, accounting for 27-28% of total tax revenues.
What do the numbers say?
● Post-covid, GST collections have exceeded revenues from corporate tax. GST revenues will remain a focus of the government’s revenue efforts.
● Given that GST is a tax on consumption, the current weakness in personal consumption expenditure can drag GST growth.
Key stat
4%: Growth in private consumption expenditure in the economy for 2023-24, down from 6.8% a year earlier.
Also read: Economic Survey: The government’s recipe for growth, in 12 charts
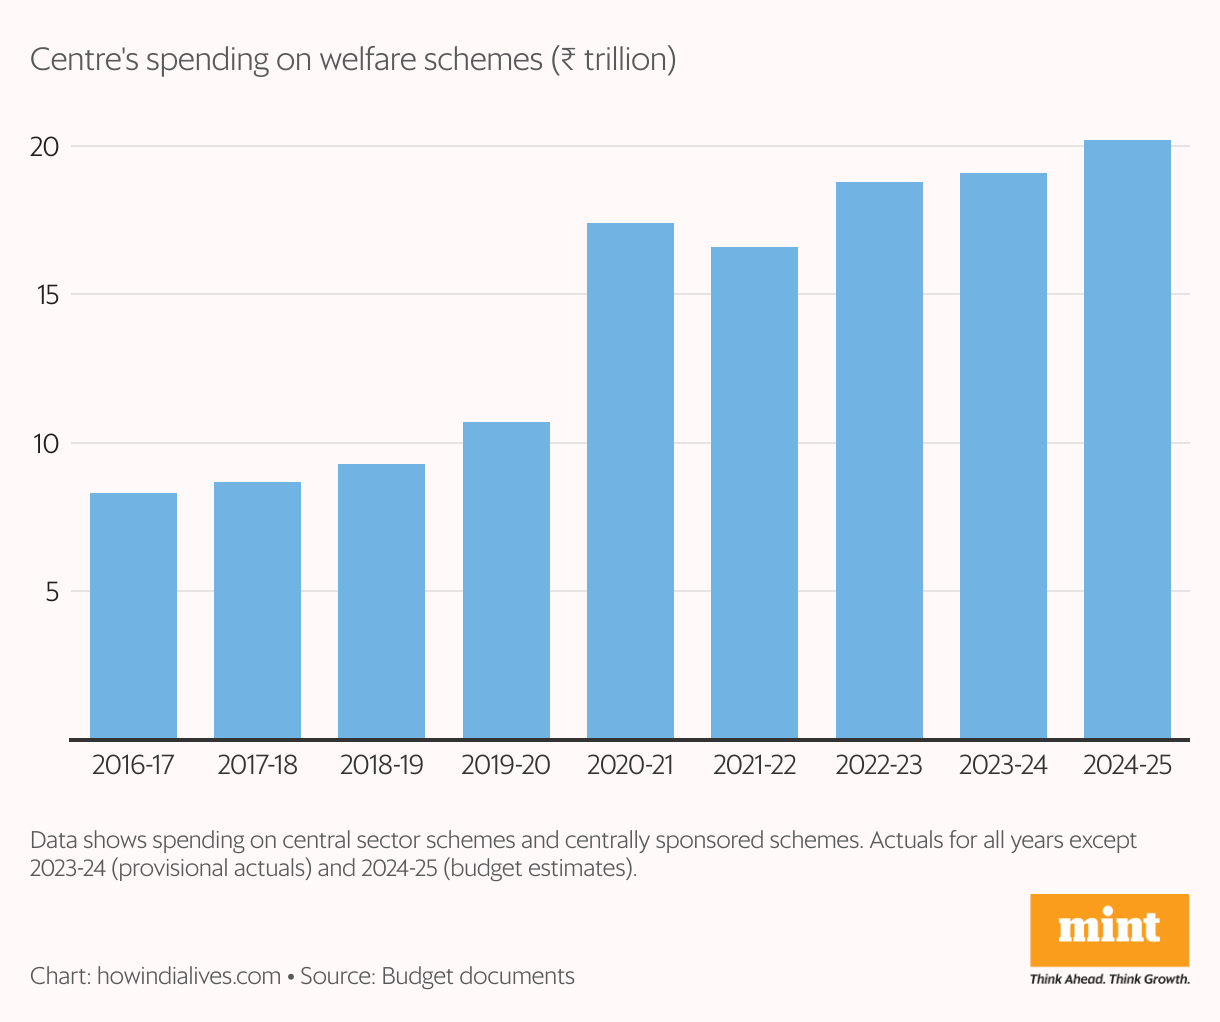
Welfare Spending
Why does it matter?
Welfare spending addresses pressing gaps in basic needs of the poor and also puts more money in their hands. Continued weakness in employment growth and an underwhelming electoral showing, means the government is likely to be heavily focused on increasing allocations under current welfare schemes, and introducing new ones.
What do the numbers say?
● During covid years, welfare spending shot up. Since 2019-20, the average increase is 13.5% per year, against 8.8% in the three previous years.
● Welfare schemes as a share of GDP rose from 5.3% in 2019-20 to 8.8% in 2020-21, before falling to 6.4% in 2023-24.
Key stat
6.1%: Estimated welfare spending by the centre as a share of GDP in 2024-25.
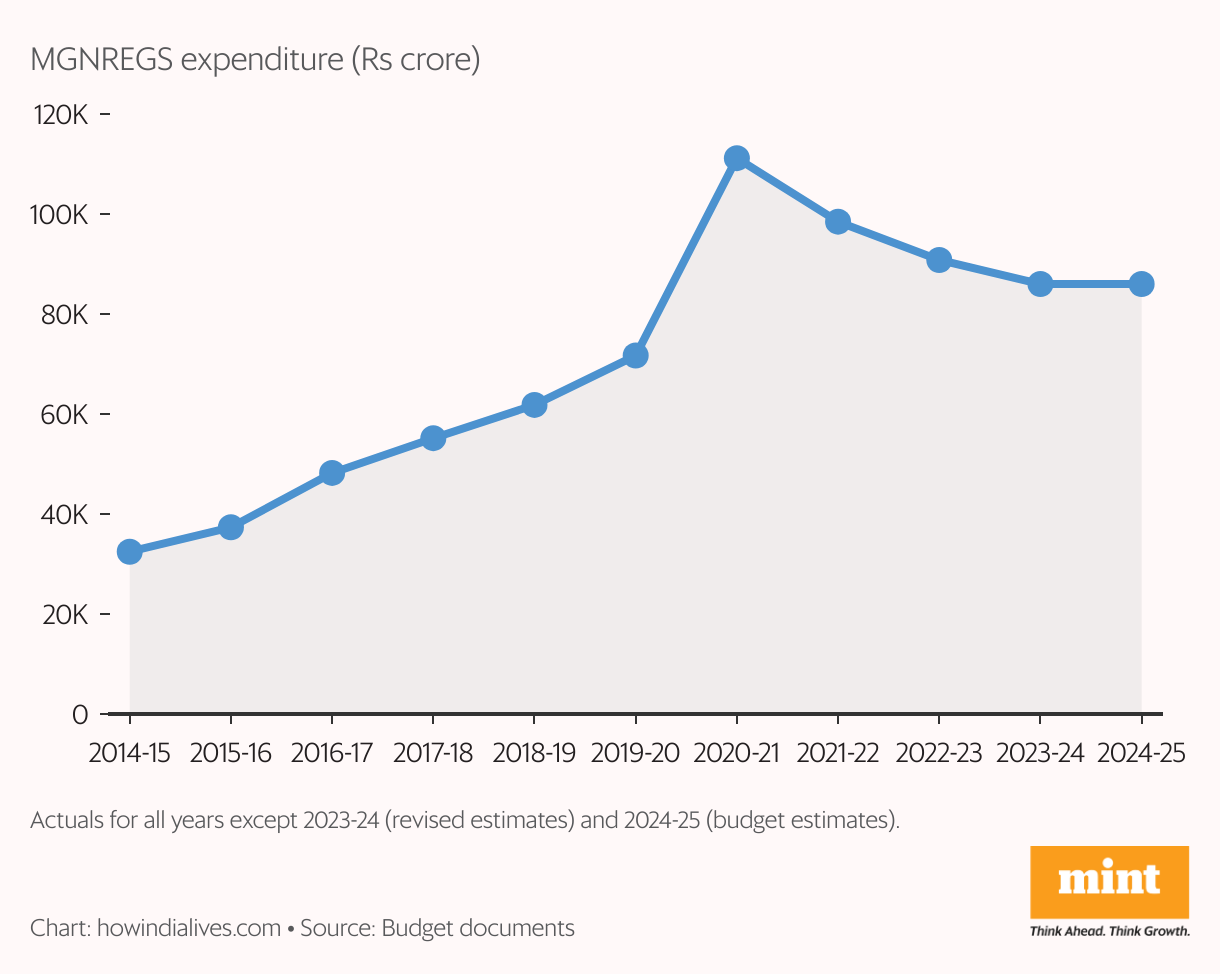
MGNREGS Spending
Why does it matter?
The Mahatma Gandhi National Rural Employment Guarantee Scheme (MGNREGS) assures employment of 100 days a year to rural households. For rural workers, it serves as fallback employment. Challenges in new jobs and the knockdown effects of covid-19 have seen demand for the scheme stay high.
What do the numbers say?
● In 2020-21, in the backdrop of covid-19, spending peaked at ₹1.11 trillion. But even before covid, spending was rising.
● The ₹86,000 crore budgeted for 2024-25 matches 2023-24 spending and is 20% higher than 2019-20, the last pre-pandemic year.
Key Stat
9: Number of years in this BJP-led government’s tenure, out of 10, in which the MGNREGS spend has exceeded its initial estimate.
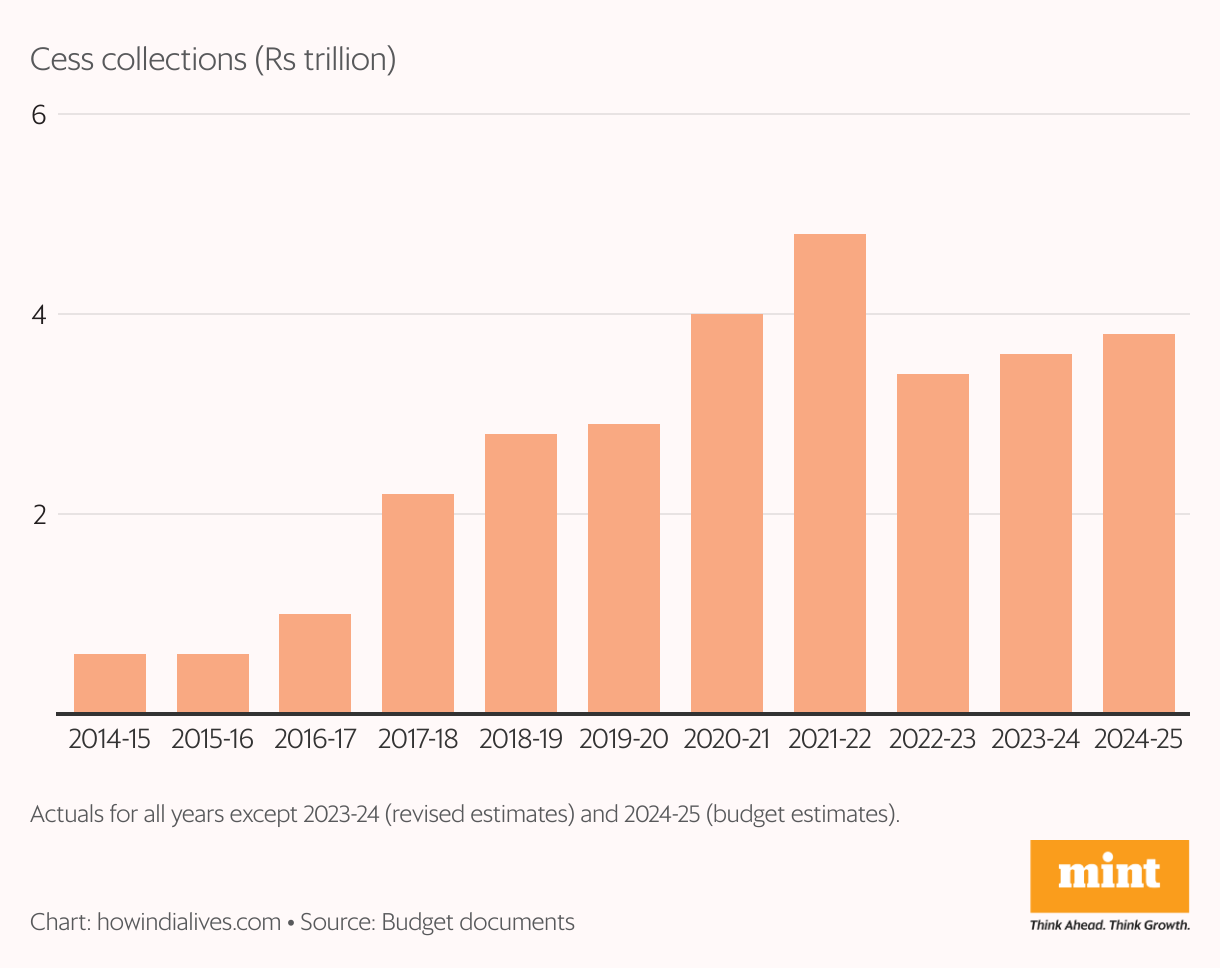
Cess
Why does it matter?
India is a federal country, which means the Centre shares taxes collected by it with states via a formula fixed once in five years. At present, the share of states is 41%. The Centre has another tax levy called cess, which it needn’t share with states. That said, cess can only be spent for the purpose for which it’s collected (for example, building roads).
What do the numbers say?
● In the last decade, cess collections grew at a compounded rate of 20%, while tax collections increased 12%.
● About 15% of taxes collected by the centre in 2024-25 will come from cess, against 3.4% in 2014-15.
Key stat
32%: States’ share of the Centre’s tax receipts (against the mandated 41%) if cess was also added to the kitty.
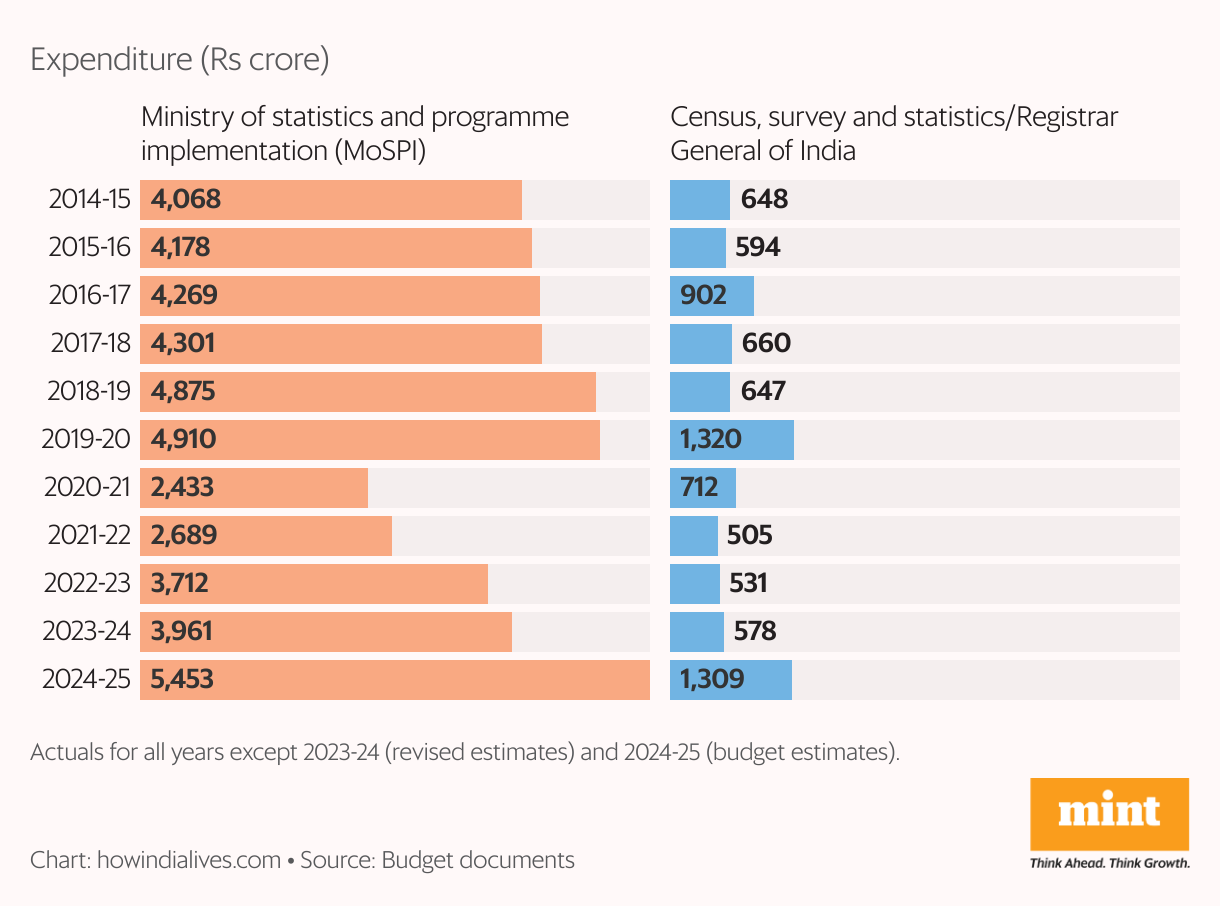
Census and other data
Why does it matter?
Under the BJP-led government, prominent data releases have seen a pullback, notably the decennial census due in 2021. Since it surveys every citizen and household, the Census forms the best data backbone to design and implement welfare programmes. Not having updated Census data means eligible beneficiaries being left out.
What do the numbers say?
● The office that conducts the Census was allotted ₹1,565 crore in 2023-24, but it spent only ₹578 crore.
● In 2010-11, when the Census was last conducted, the Centre spent ₹2,726 crore towards the Census.
Key stat
66%: Allocation to MPLADS scheme, where an MP can recommend projects worth ₹5 crore per year, from the 2023-24 statistics ministry budget.
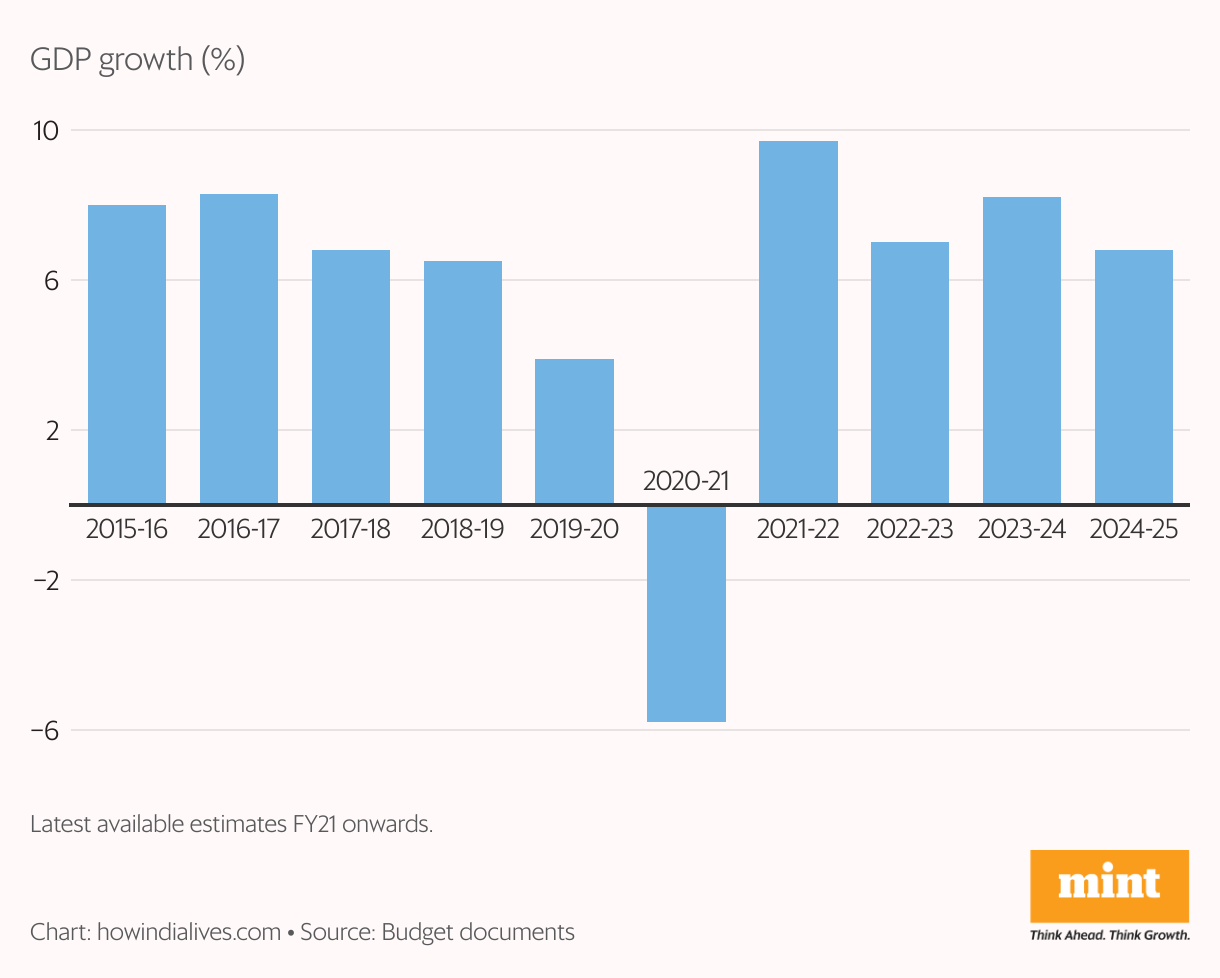
GDP Growth
Why does it matter?
GDP growth is the foundational block that enables an economy to create jobs, and the government to collect more taxes and invest it in social and physical infrastructure. This is essential to lift quality of life. Between 1982 and 2012, China grew above 8% in 25 out of 30 years, lifting its per capita income from $203 to $6,300.
What do the numbers say?
● Even before covid-19 hit India in March 2020, GDP growth had slowed for three consecutive years.
● Excluding the Covid years of 2020-21 and 2021-22, 2023-24 was the first time in five years that GDP growth topped 8%.
Key stat
16.5%: Unemployment rate among 15-29 years as on December 2023, against 21.6%in June 2019, as per government data.
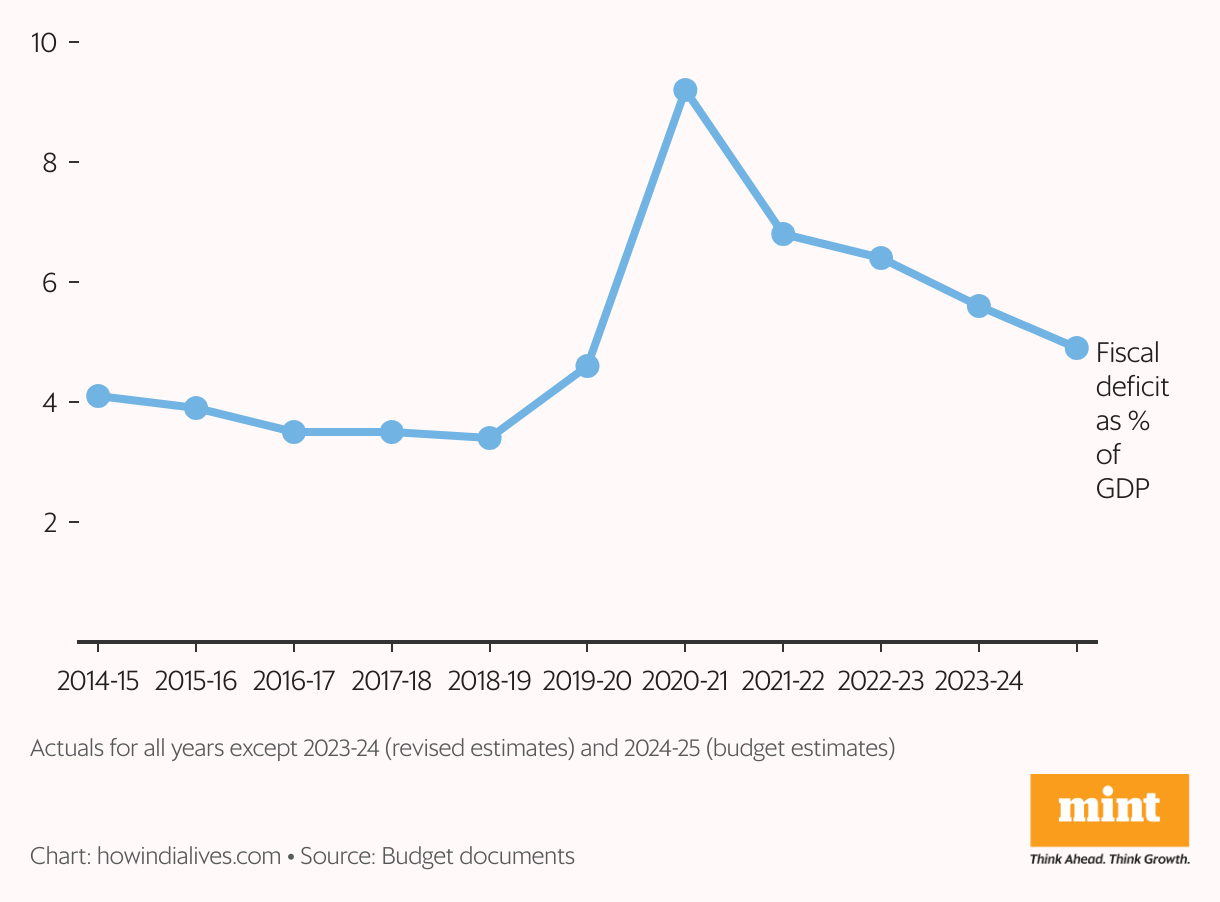
Fiscal Deficit
Why does it matter?
This is a measure of how much the government is living beyond its means, and is expressed in relation to the country’s economic output. The lower this value, the better. To bridge this deficit, the government has to borrow. Lower borrowings can lower interest rates, and boost consumption demand.
What do the numbers say?
● As per the Fiscal Responsibility and Budget Management (FRBM) Act, 2003, fiscal deficit was to be contained at 3% of GDP by March 2021.
● The Centre was gliding to that target in 2018-19, but slow growth and covid-19 reversed that progress.
Key stat
56%: The Centre’s projected debt-to-GDP ratio by March 2025. Under the FRBM Act, it was to be contained at 40% of GDP.
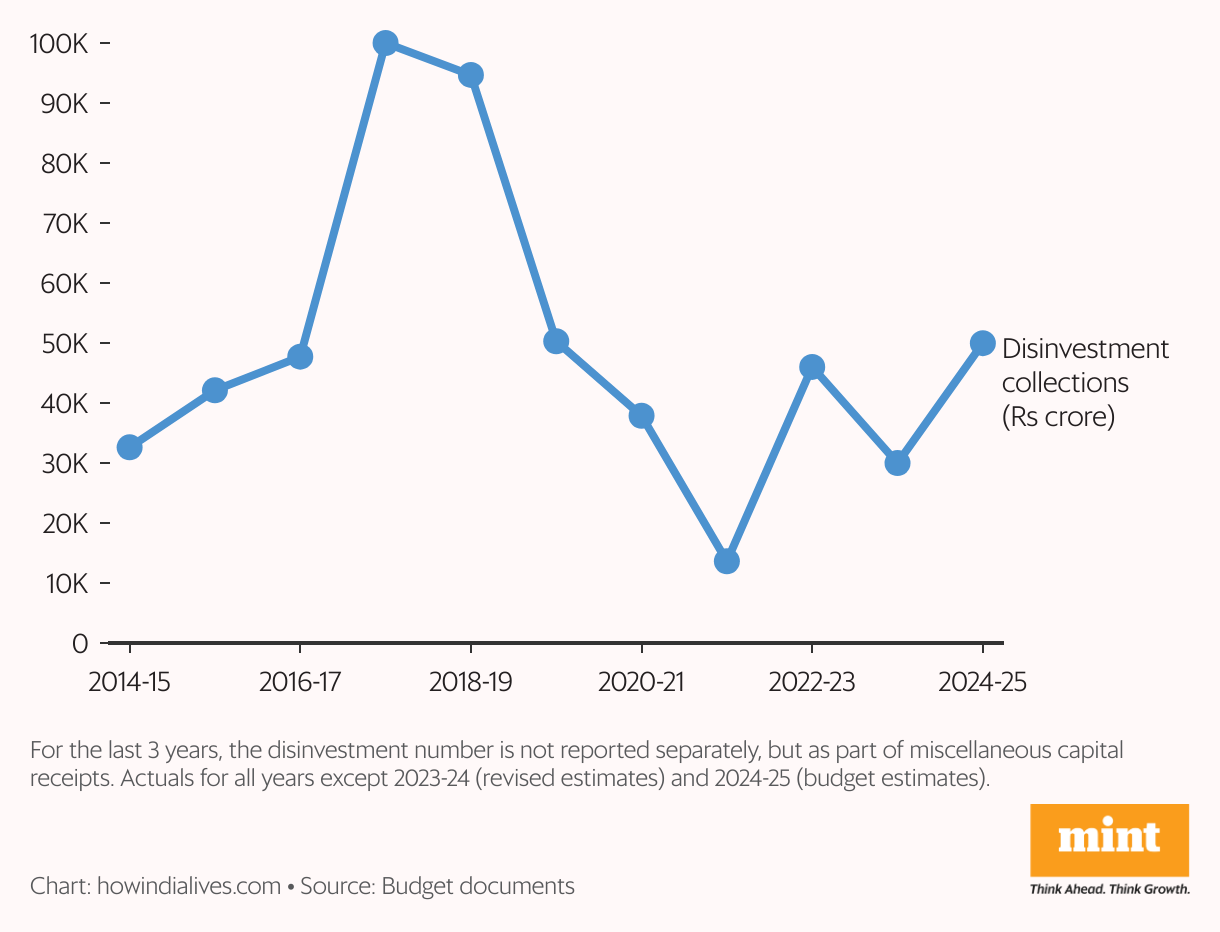
PSU Disinvestment
Why does it matter?
It’s no longer the government’s business to be in business, goes one view. There was a time when, post-independence, India was building and the private sector was weak. But after India opened its economy in 1991, that changed, and successive governments have sold or merged many public sector undertakings (PSUs).
What do the numbers say?
● Even this BJP-led government, in 2014, said it would pursue strong disinvestment agenda in sectors of a non-essential nature.
● Post-2020, other than Air India, disinvestment in the truest sense is off its radar. Even data on it is not being reported separately now.
Key stat
11%: Average annual return in the past 10 years given by the BSE PSU Index, against 12.3% from the benchmark BSE Sensex.
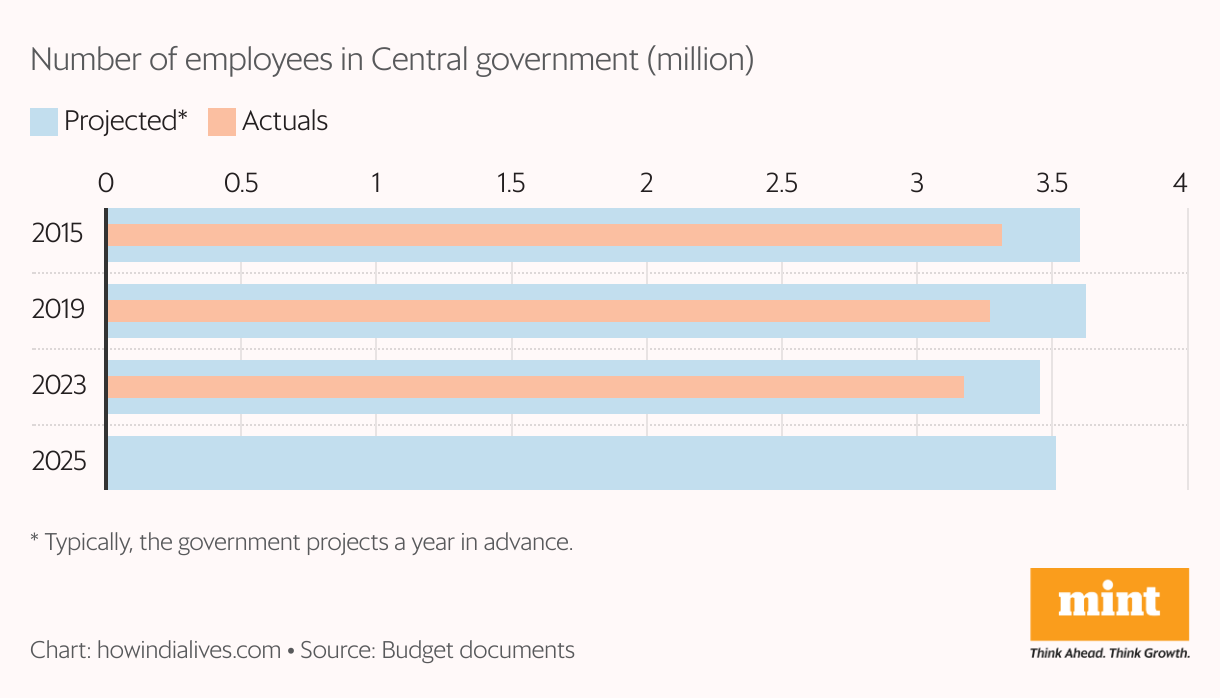
Government jobs
Why does it matter?
The key challenge before the Indian economy has been, and remains, the creation of new jobs. Every avenue counts. One of those avenues, and a prized one at that, is government jobs, at both the central and state levels. The central government employs about 3.17 million and has been looking to expand.
What do the numbers say?
● Between March 2015 and March 2023, however, the staff count of the central government shrunk by about 139,000.
● There is usually a gap between how many the government wants to employ and how many it actually does.
Key stat
8%: The gap between the employment numbers projected in Budget 2022 and the actual strength in March 2023.
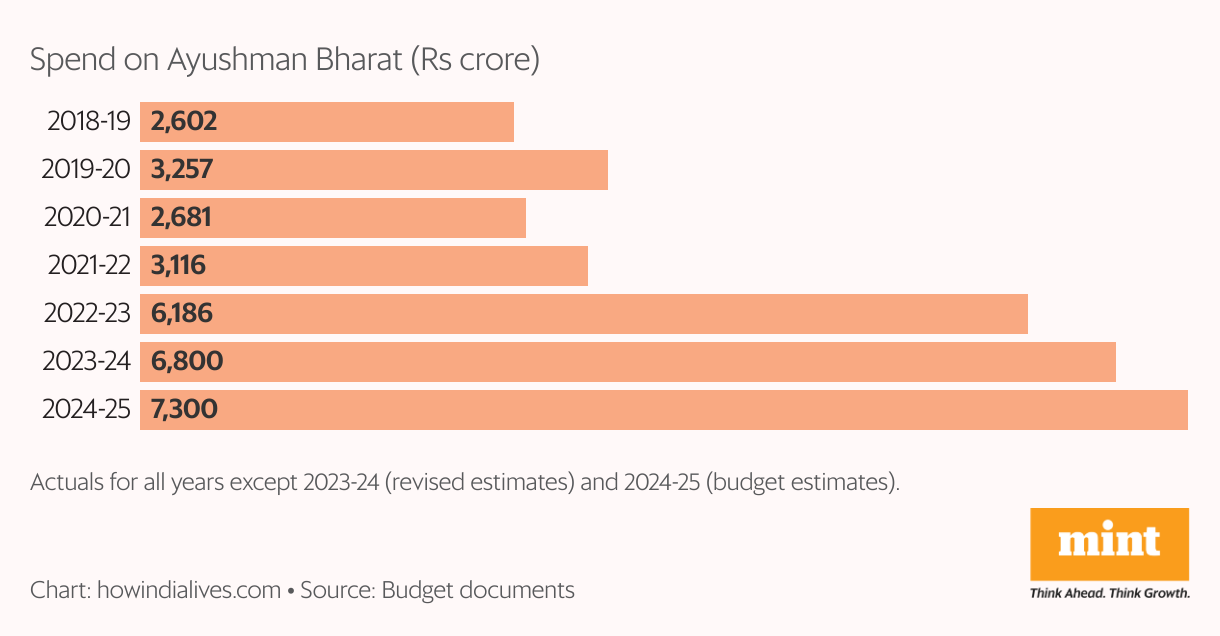
Ayushman Bharat
Why does it matter?
As per government data, 90% of Indians spend less than ₹9,582 per month. Thus, a large health spend is likely to push such households into high debt and poverty. Ayushman Bharat, launched in September 2018, was intended to prevent this. It gives households health cover up to ₹5 lakh per year.
What do the numbers say?
● As on November 2022, 79 million households—73% of targeted households—were enrolled. The centre wants to cover 120 million households.
● Uneven hospital coverage is an issue. For example, Uttar Pradesh has 5 hospitals per 1 lakh population and Karnataka 21.
Key stat
47.1%: Average out-of-pocket expenditure as share of total health expenditure in 2019-20, the latest data available.
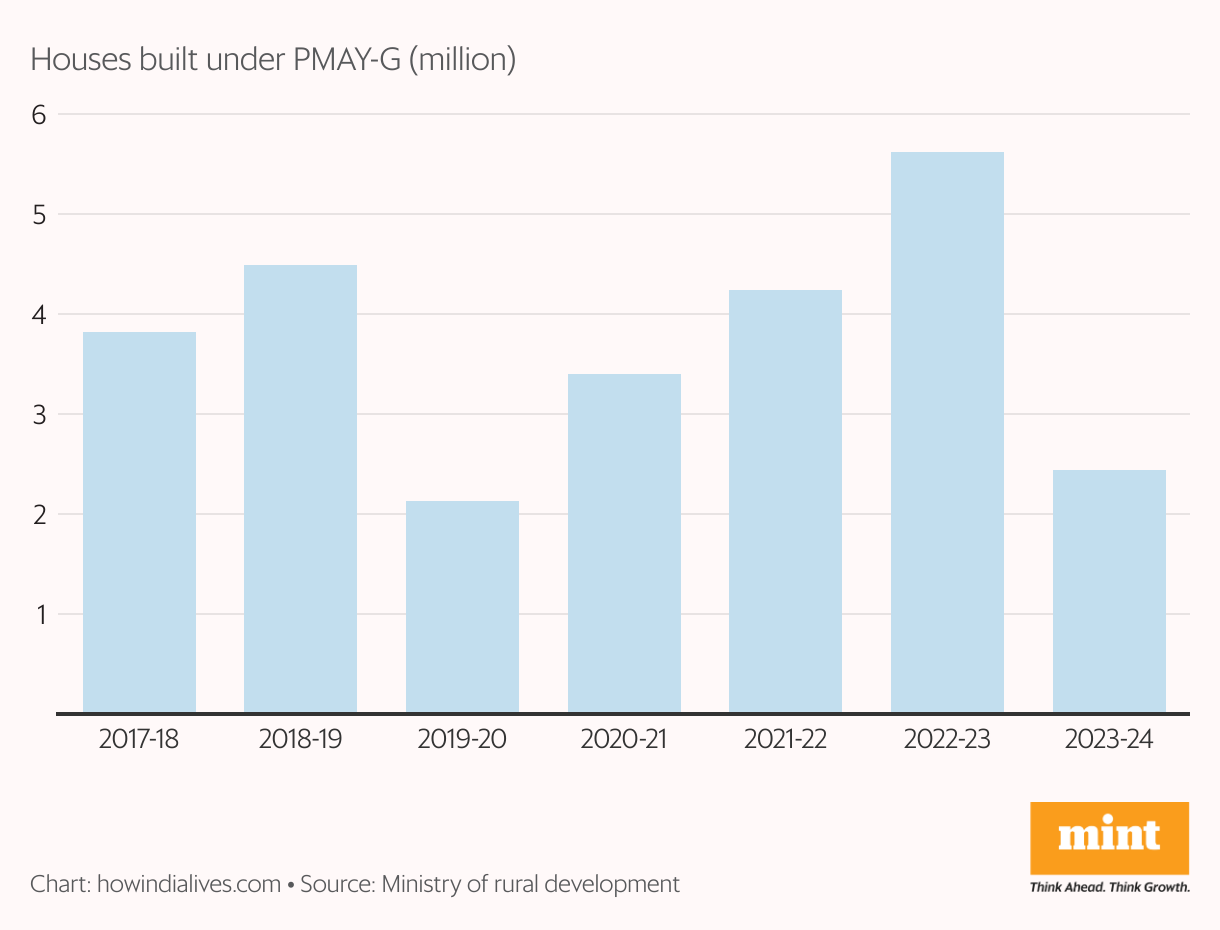
Pradhan Mantri Awaas Yojana–Gramin (PMAY-G)
Why does it matter?
PMAY-G, a rural housing scheme, is important for three reasons. One, it provides all-weather houses to the rural poor. Two, it generates demand for steel and cement sectors. Three, it generates employment. This boosts private consumption, which accounts for around 60% of GDP but has been sluggish.
What do the numbers say?
● 26.3 million houses were built till March 2024, against the 29.5 million target. The target for the next five years has been increased by 20 million.
● In the last eight years, central and state governments together have spent ₹3.7 trillion towards PMAY-G.
Key stat
27%: Share of PMAY-G houses owned solely by women. This is double of what the National Family Health Survey estimated for 2019-20.
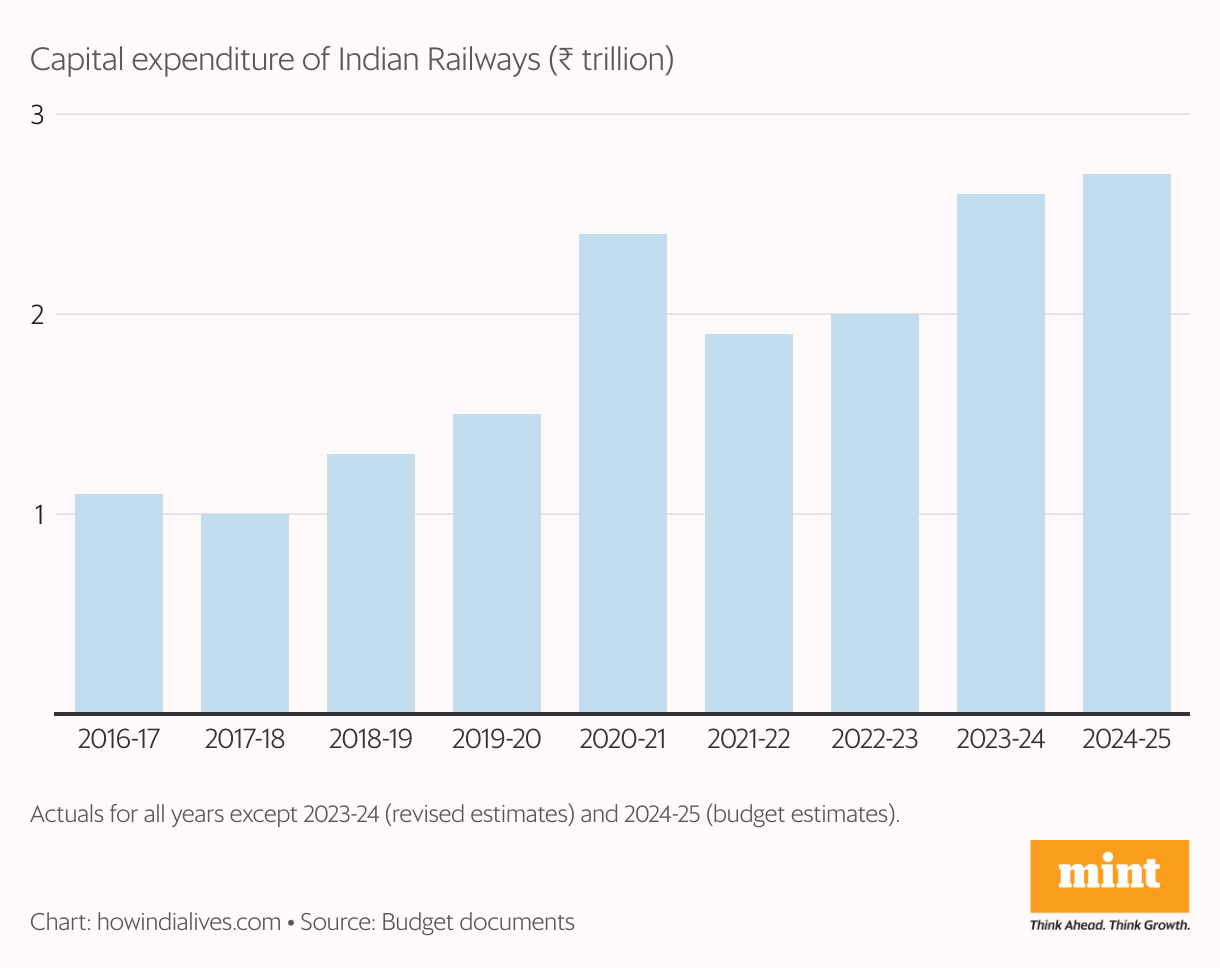
Capital Spend by Railways
Why does it matter?
The Indian Railways is in desperate need of investment, whether it is for new safety equipment, bogies, or to maintain existing lines and build new ones. Its revenues, however, are barely enough to cover operational and pension expenses. Thus, it is the centre that foots a large part of railways’ capex bill.
What do the numbers say?
● Budgeted capex growth for 2024-25 was 1.9%, down from 2.8% a year before.
● Railways capex as a share of GDP has remained flat since 2022-23, at just under 1%.
Key stat
1.2%: Highest rate of railways capex relative to GDP till date, in 2020-21.
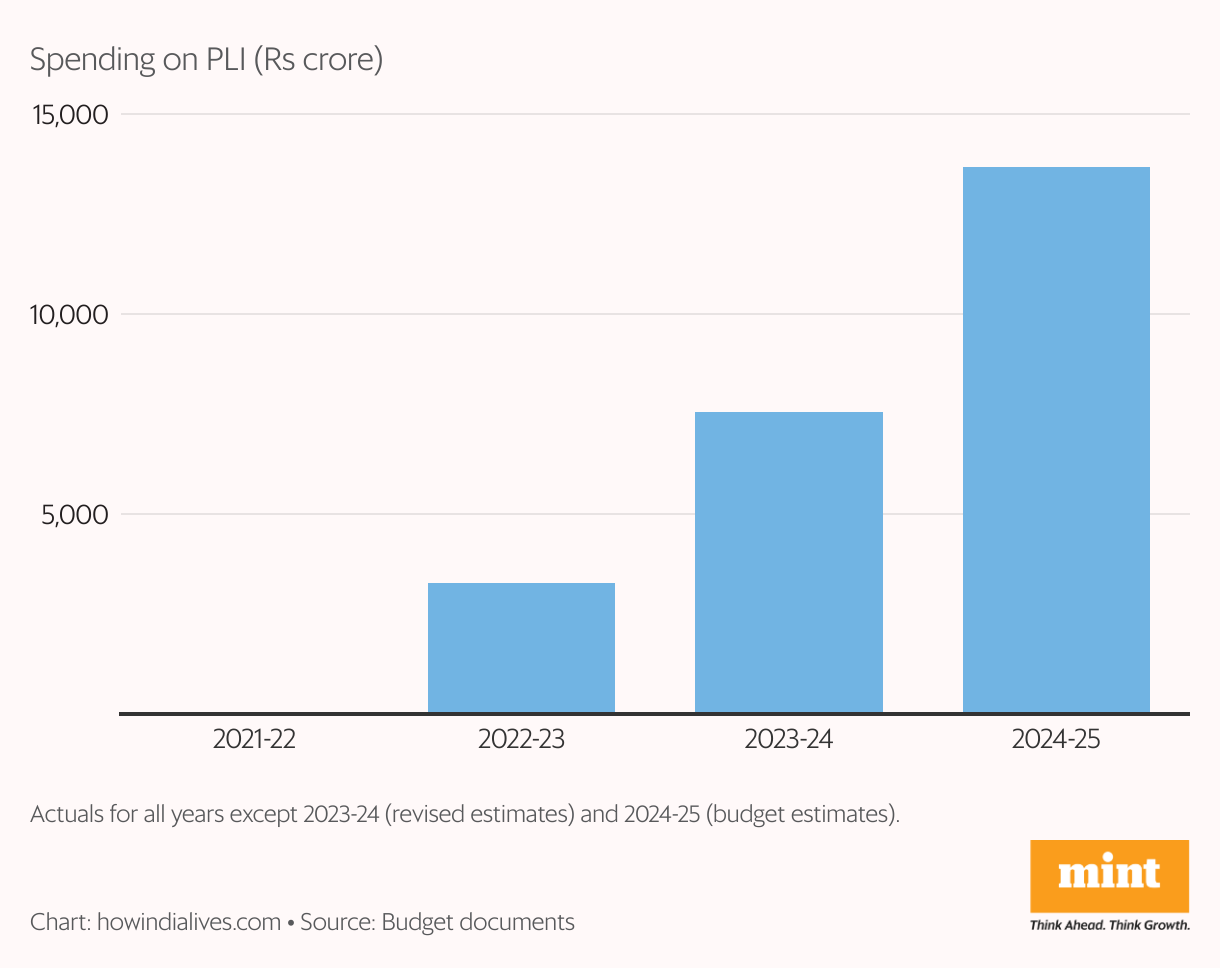
PLI Scheme
Why does it matter?
Manufacturing has been a weak link for the Indian economy. As one lever to change this, this government introduced the production linked incentive (PLI) scheme, which subsidises domestic manufacturing by companies across a range of key sectors, including auto, IT hardware and pharma.
What do the numbers say?
● The centre’s intended outlay for the scheme, launched in March 2020, is ₹1.97 trillion. As of 2023-24, total expenditure isRs 10,821 crore.
● Of the amount spent under the budget, ₹3,121 crore was in pharma and ₹4,559 crore in the electronics and IT sector.
Key stat
₹13,669 crore: Amount budgeted to be spent under the PLI scheme for 2024-25—a 81% increase over 2023-24.
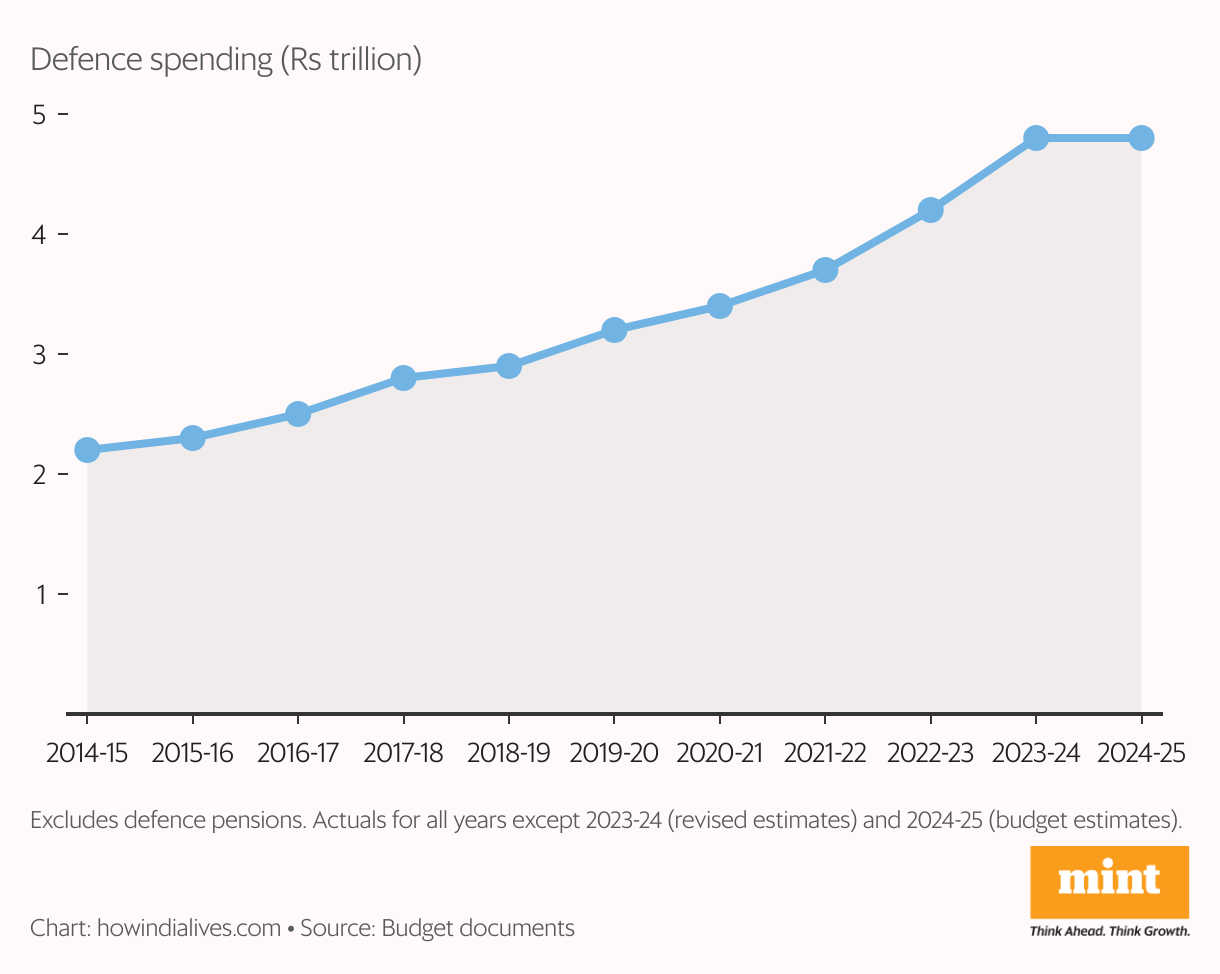
Defence Spending
Why does it matter?
BJP governments have typically been hawkish about defence and defence spending. The BJP’s election manifesto promised creation of new military commands and a greater naval presence in the Indian Ocean. Along with the need to buy spares to maintain combat readiness, this will require a big jump in defence expenditure.
What do the numbers say?
● In spite of the hawkish stance, defence spending has remained in a narrow range of 1.4-1.6% of GDP since 2015-16.
● For 2024-25, the projected spending ofRs 4.8 trillion is virtually unchanged from 2023-24.
Key stat
-0.1: Change in defence expenditure relative to GDP (in percentage points) in 2024-25 compared with 2019-20.
www.howindialives.com is a database and search engine for public data.

