
Consumption data lays bare India’s deep inequality—and leaves behind a big question
")
The question is: do government freebies help bridge inequality, and are they even reaching the ones most in need? An analysis of the latest consumption spending survey shows it works partly, but may need to be targeted better.

India is dazzling the world with its ‘fastest-growing major economy’ tag, rapidly expanding infrastructure, cashless payments, and soaring stock markets. Yet, the growth story that led to a massive poverty reduction in the past three decades has also been under scrutiny for inducing deep inequality in recent years.
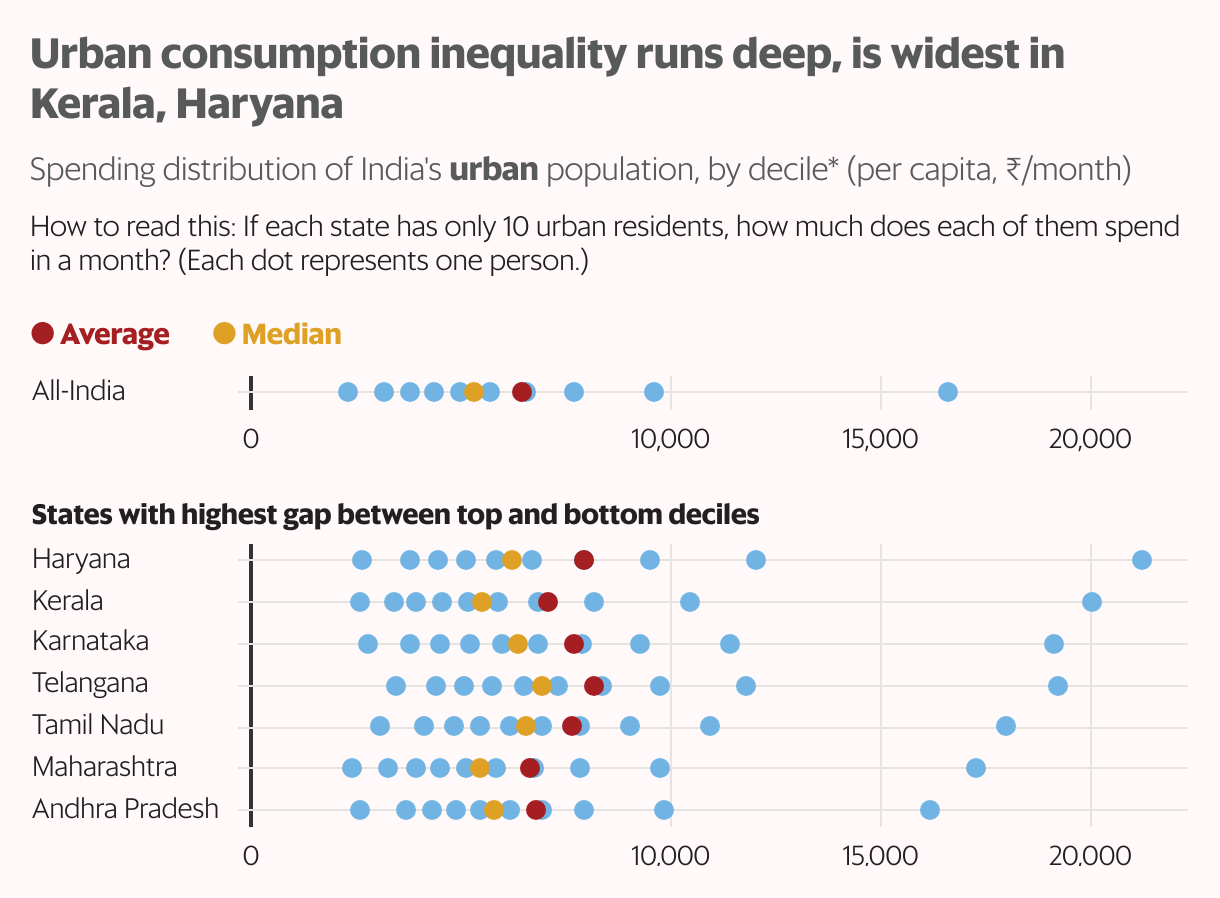
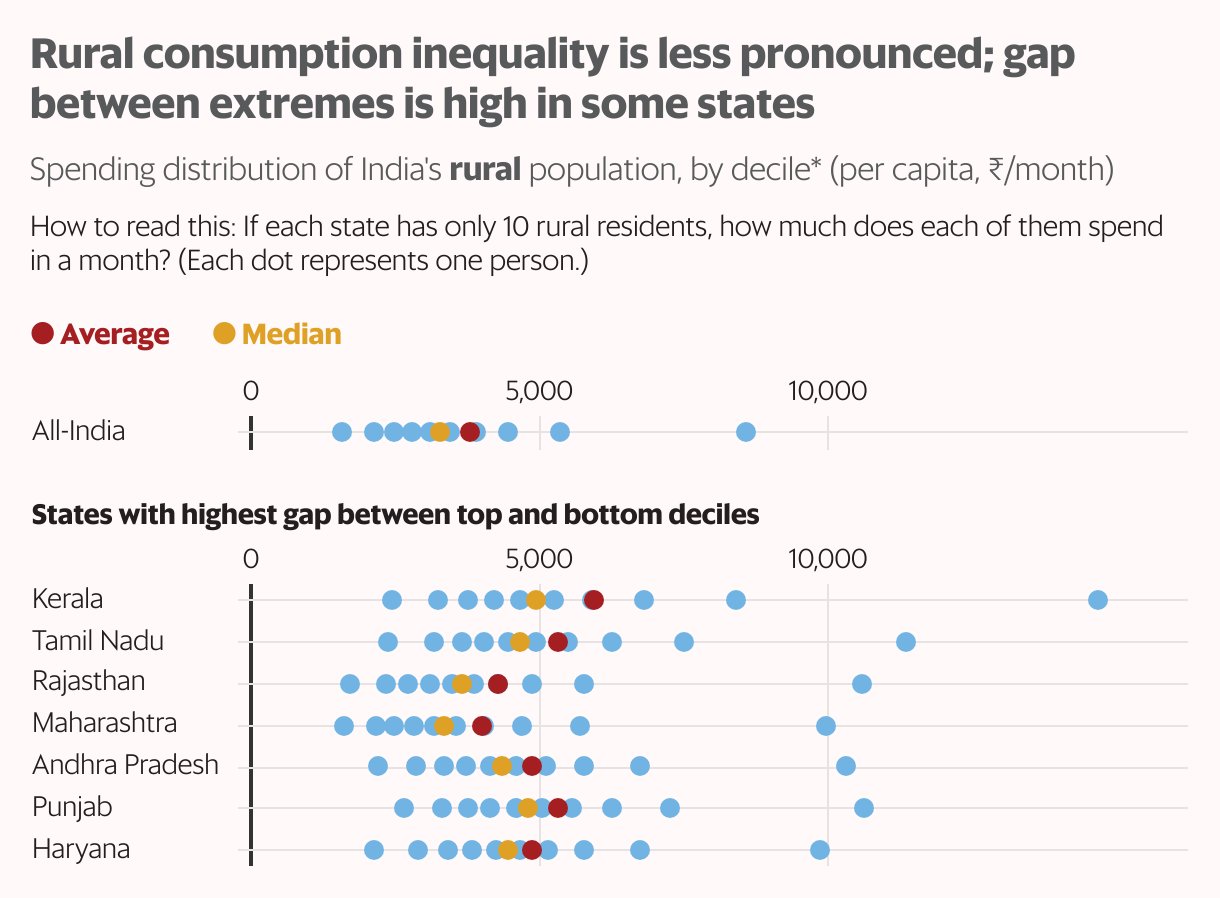
Seen in terms of household budgets, the top 10% of the urban population spends ₹16,612 per head per month, which is 3.1 times what the median person spends, according to a Mint analysis of the 2022-23 Household Consumption Expenditure Survey. In rural areas, the top 10% spends ₹8,569, compared to a median of ₹3,268, a gap of 2.6 times.
Read This: What the long-due consumption survey data shows—and what it doesn’t
On the surface, both urban and rural inequalities have declined since the last available survey from 2011-12, with a sharper decline in urban areas. However, the two surveys are not strictly comparable due to significant methodological changes, making it difficult to determine whether the progress is due to policy changes or improved data collection. Additionally, despite adjustments to better capture the consumption of the affluent, the survey might still underrepresent this group as their money is not solely directed towards consumption but also savings.
The survey covered 155,014 rural households and 106,732 urban households across the country.
It’s clear that household consumption spending is deeply unequal—even more so in certain states and for certain groups. Take Kerala and Haryana, for instance, where the top 10% of the urban pyramid exceeds ₹20,000 in monthly spending, the highest among major states. In contrast, the bottom 10% in both states spends just around one-eighth of that amount, the widest gap in India. The report ranks the urban populations of these two states as the most unequal when measured by the Gini coefficient, a common metric for assessing inequality.
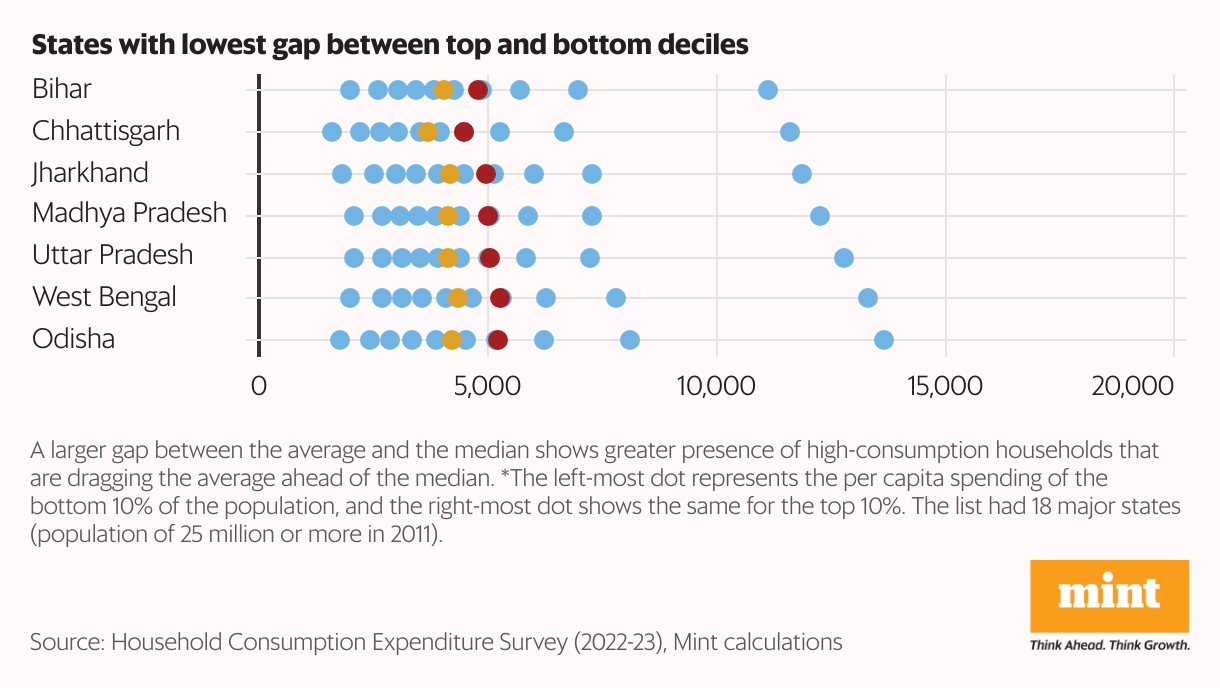
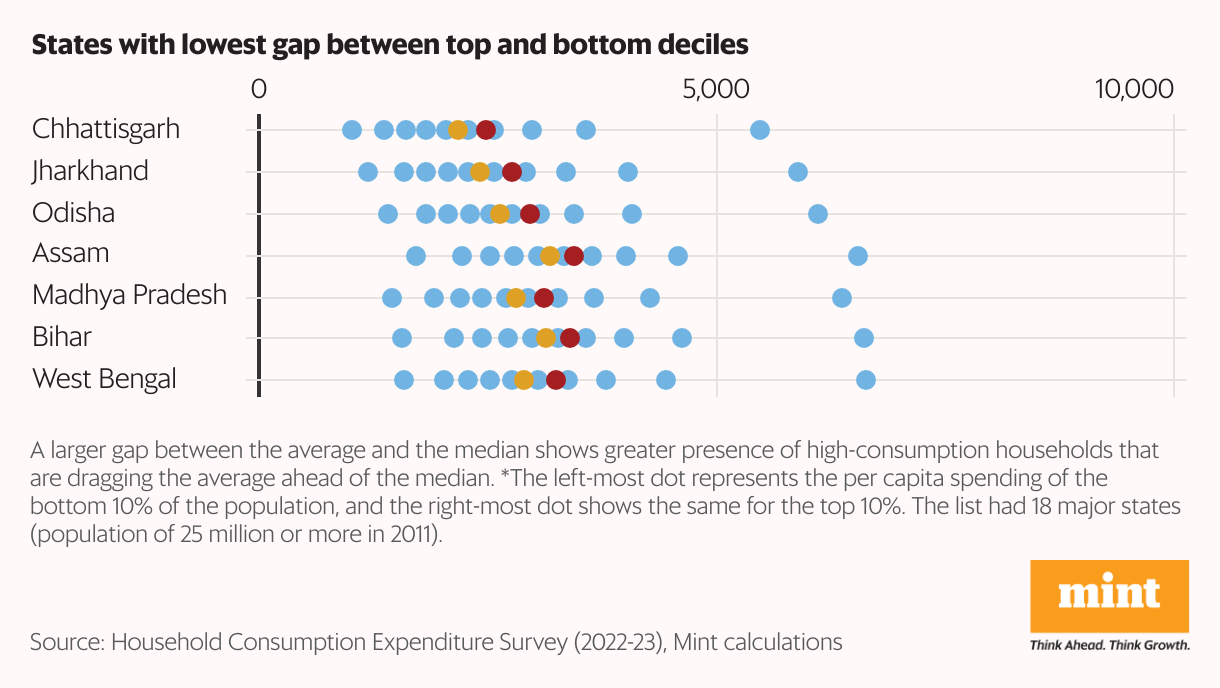
Another measure of inequality, albeit a cruder one, is the gap between average spending (total spending divided by the number of people) and the spending of the median person (the person exactly in the middle). A larger gap indicates that the more affluent population is pulling the average spending up, thereby masking the deep divide.
And This: India is all set for a consumption boom—with a caveat
More Here: In charts: Story of polls, freebies and politics
Bridging the gap
According to the survey’s report, the Gini coefficient has declined to 0.266 from 0.283 in rural areas and to 0.314 from 0.363 in urban areas, as compared to 2011-12. The Gini coefficient runs from 0 to 1, with 0 reflecting perfect equality and 1 meaning that all spending is by a single person. While the Gini coefficients could also be incomparable due to the methodological tweaks, one major change to the survey can help understand whether state-run measures to uplift India’s poor have been any help.
The survey sought to study the impact of welfare schemes—free food as well as items such as free bicycles, laptops, and mobile phones. If a household gets free items, the survey adds an ‘imputed’ value of those items to calculate the worth of items not just bought by it, but also consumed by it through welfare goods obtained for free. The difference between regular spending and spending ‘with imputation’ shows how well free welfare goods are reaching Indians.
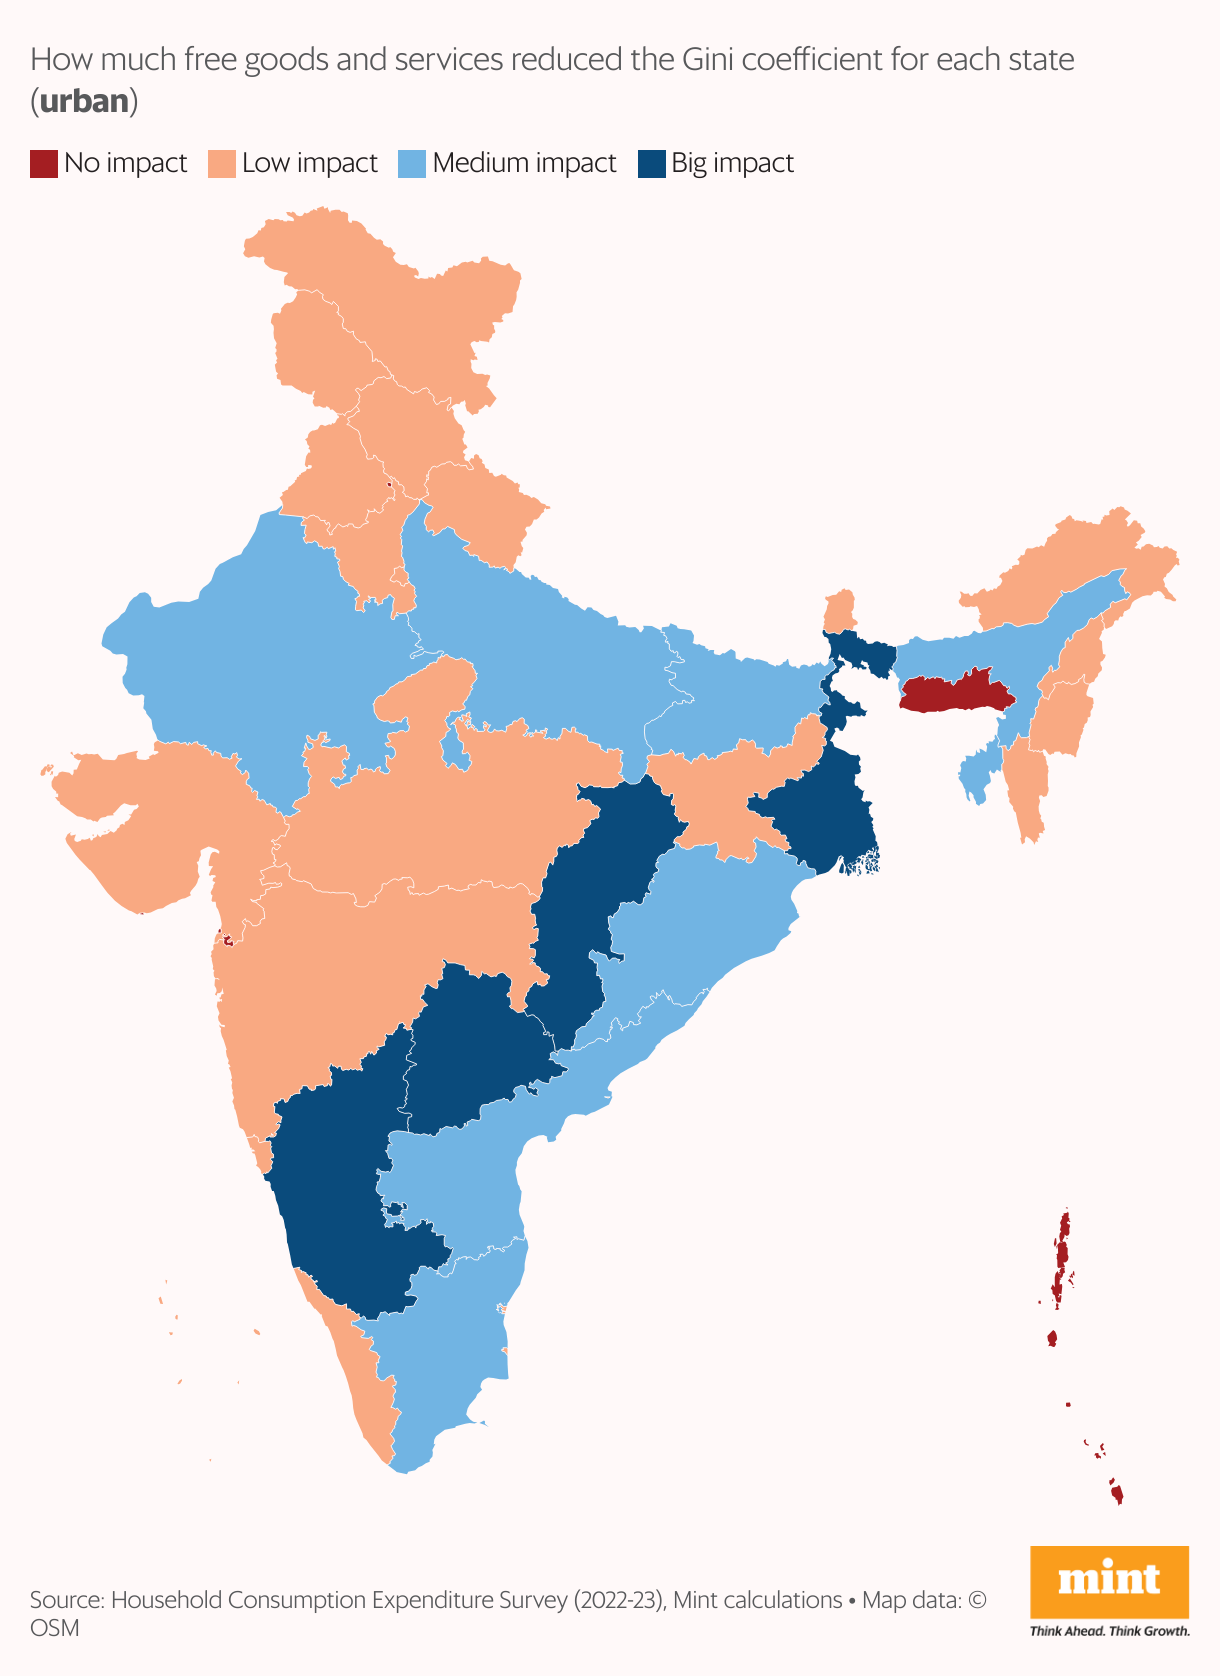
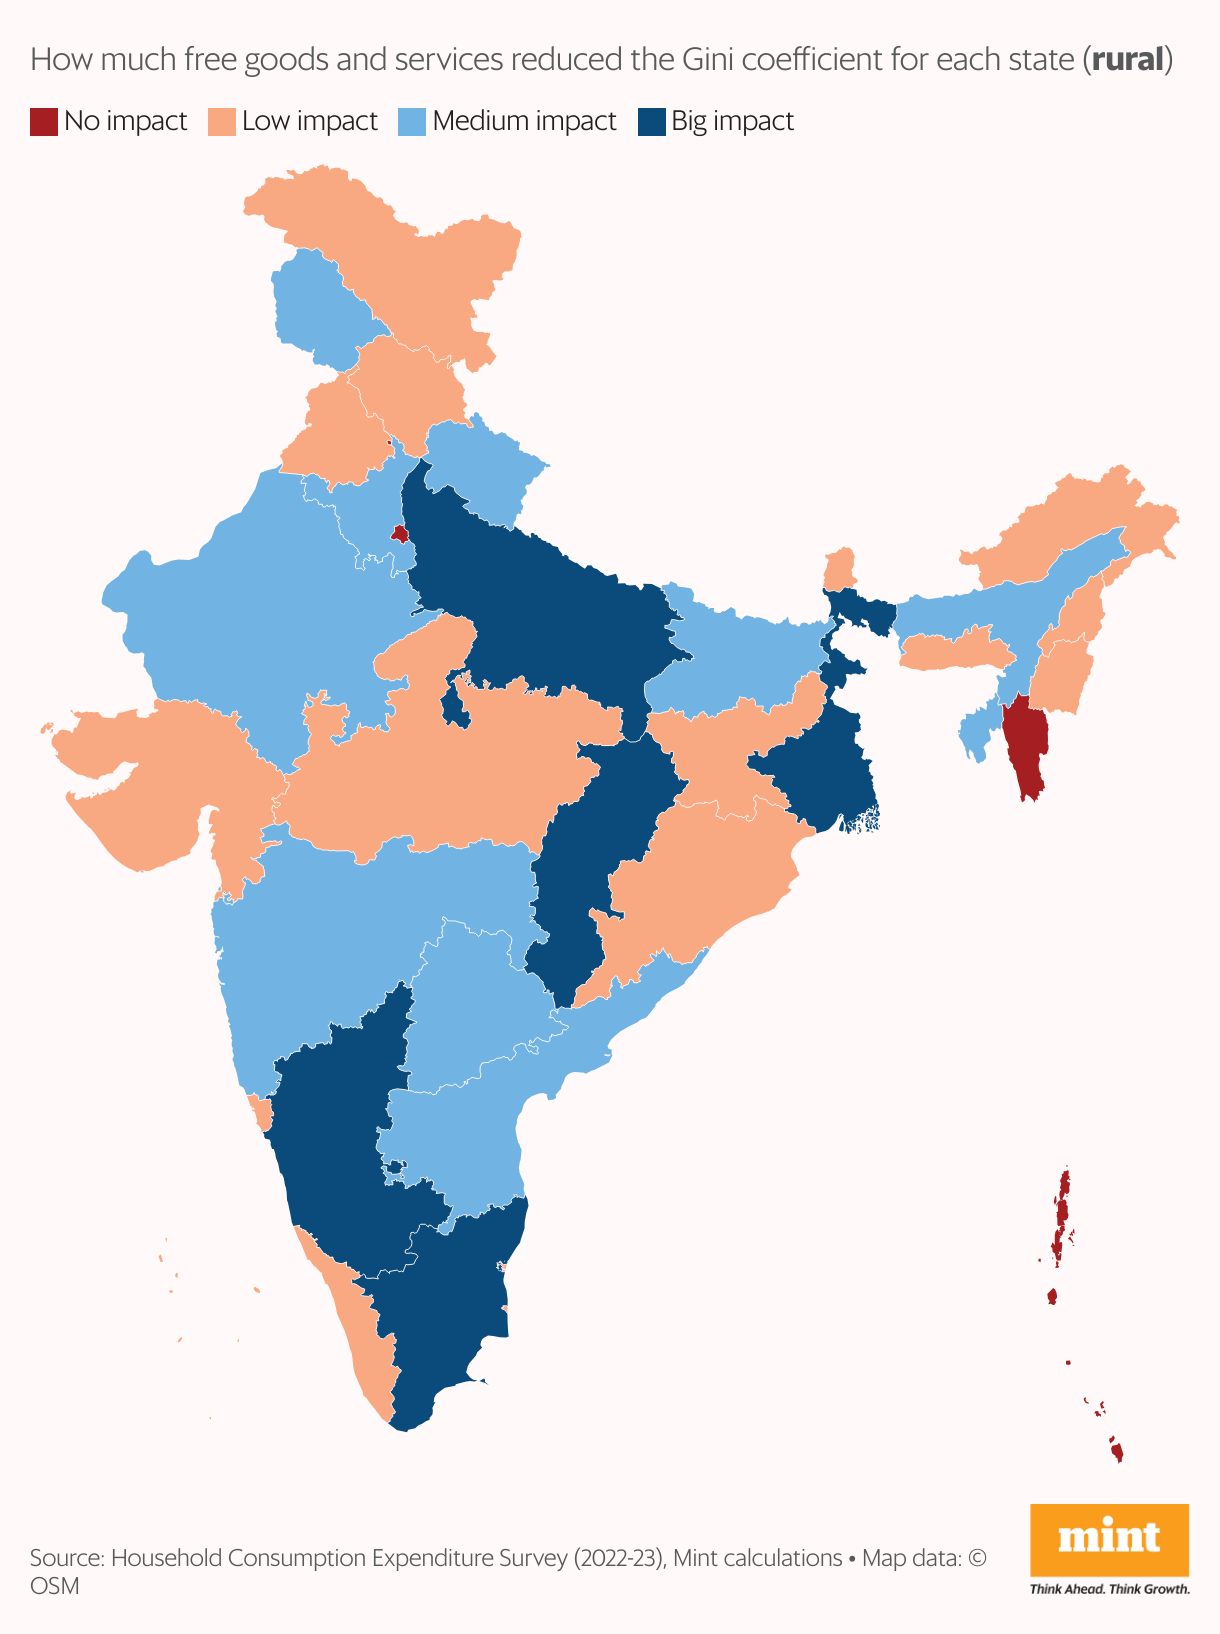
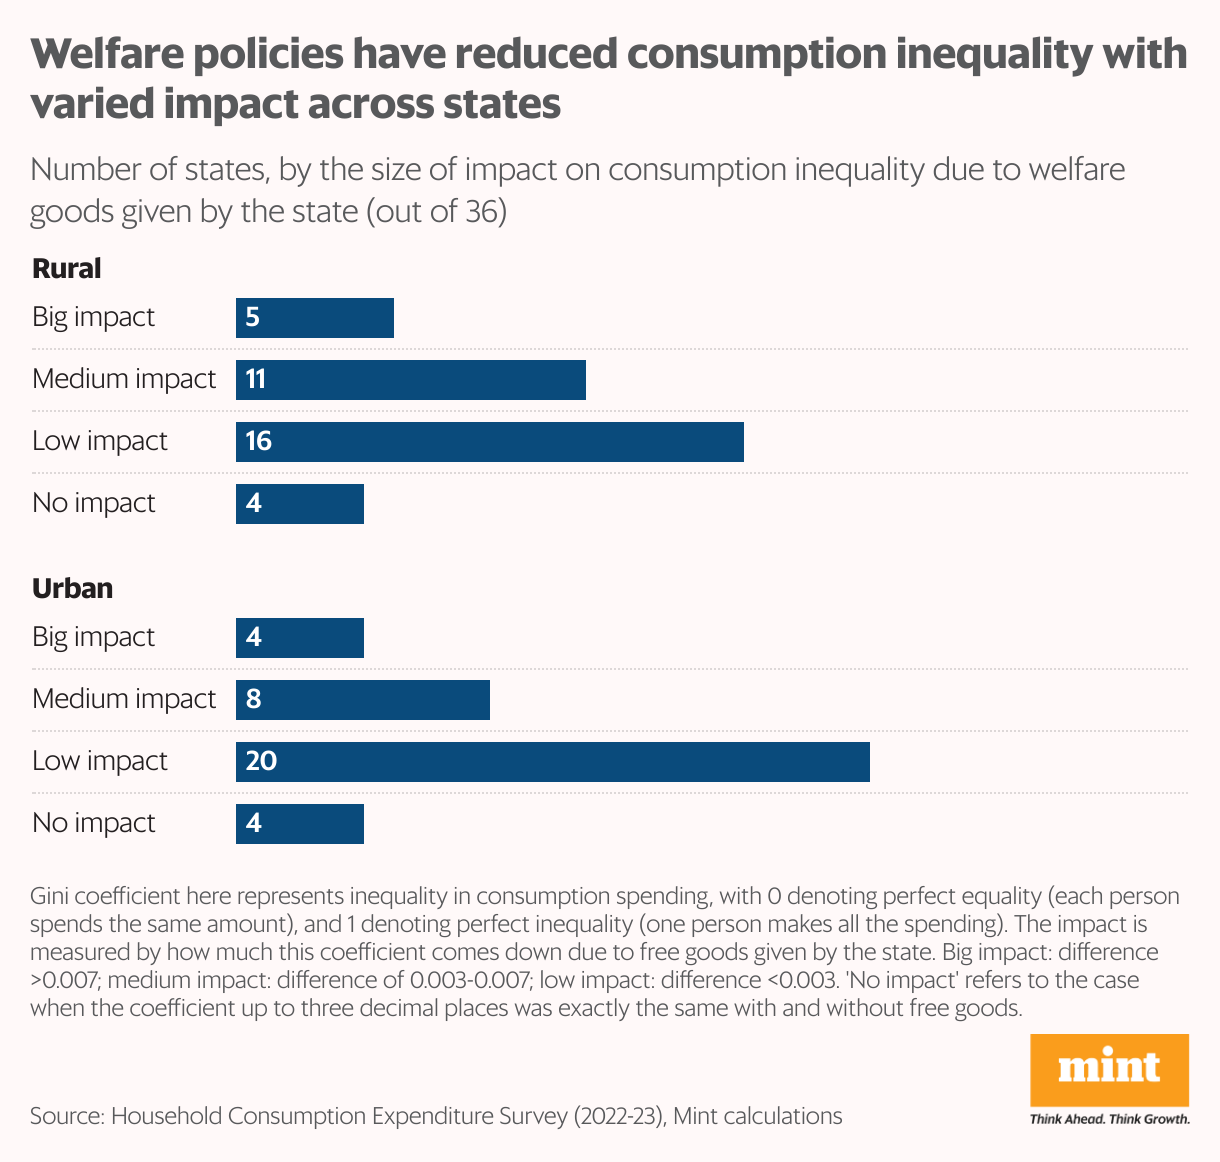
The data does suggest a wide impact of these items in reducing inequality. The Gini coefficient fell by 0.005 in both urban and rural areas after adding imputed spending. But the impact varied across states. Five states saw a big impact in rural areas and four in urban areas (big impact is a decline in Gini coefficient by over 0.007). Most states witnessed impact much lower than the pan-India figure, and some saw medium impact.
A long haul
The decline in consumption inequality could be much higher if the poorest cohort got the maximum welfare benefits. But that was not the case, putting the targeting of welfare schemes under the scanner. The bottom 5% in rural India get free goods worth ₹68 per head per month, but the people in the middle get even more: those in the eighth decile (70-80%) avail of free goods worth ₹93 per month. Ironically, even the topmost 5% of the rural population get more welfare goods in terms of value than the poorest 5%.
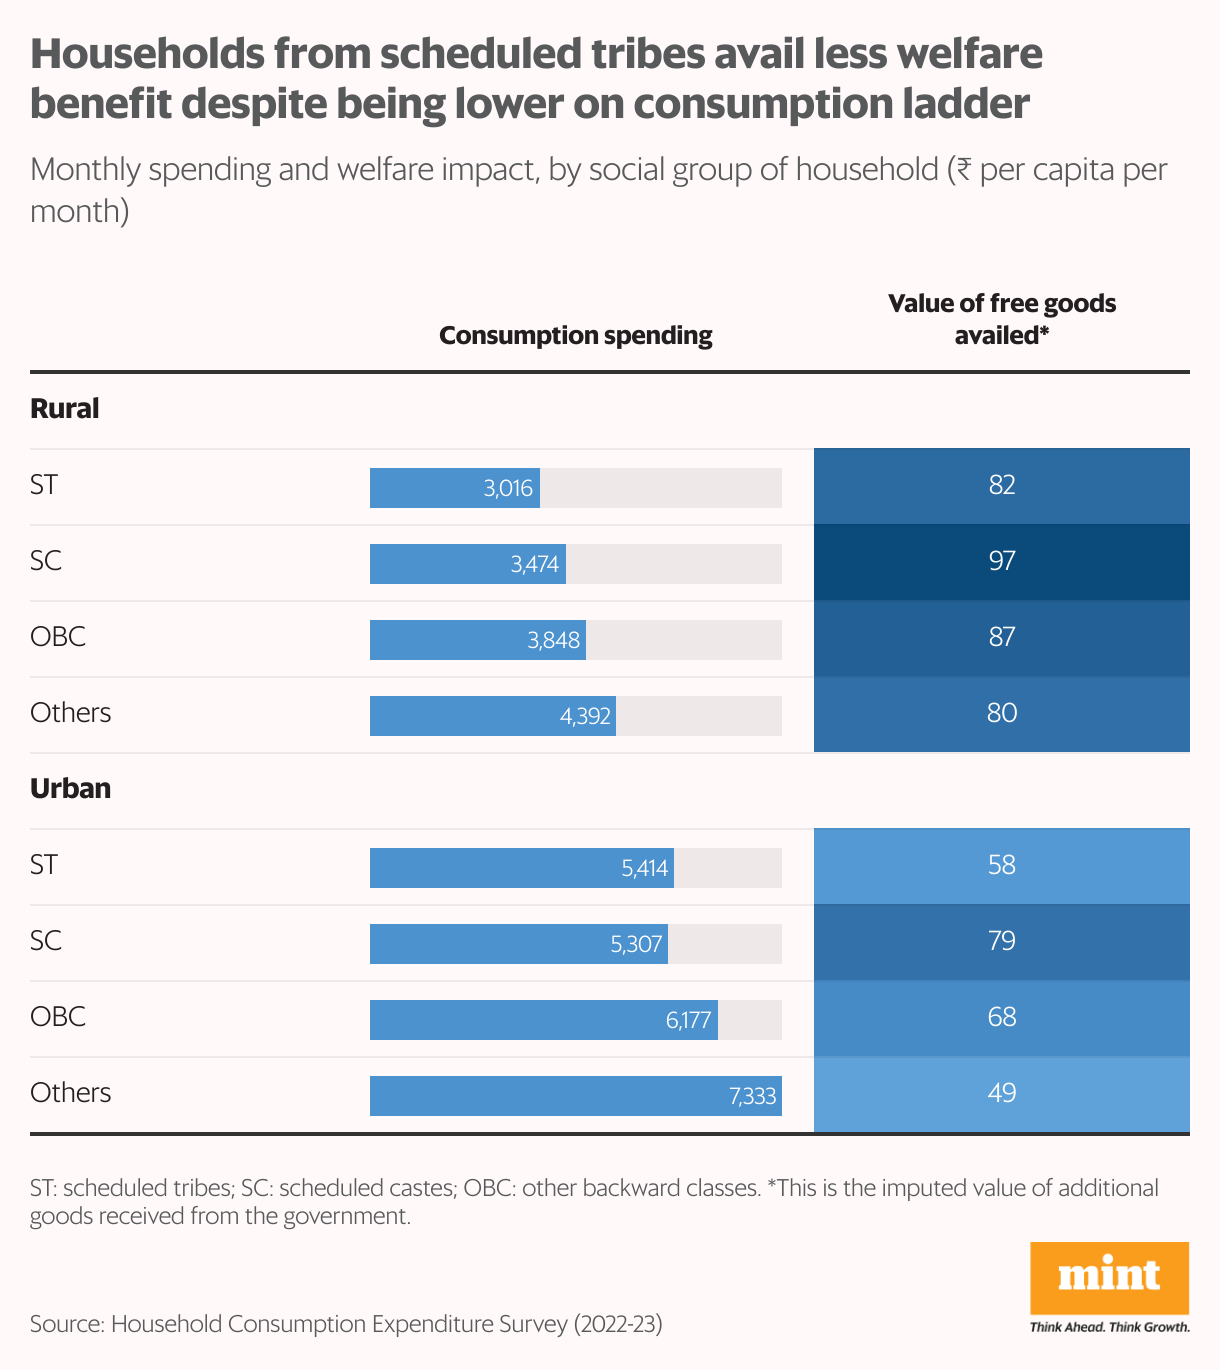
There is a disproportionate distribution of free goods along social lines too. Households from the scheduled tribes, despite spending the least, aren’t the biggest beneficiaries. In rural areas, they receive free goods worth ₹82 per capita per month, behind ₹97 for those from scheduled castes and ₹87 for other backward classes.
Experts say there are limitations to the coverage of welfare schemes and call for a more inclusive economic growth model to cut down inequality. “This survey only captures a lower level of inequality since it’s measured in terms of consumption. Income inequality is likely to be much higher," said Himanshu, associate professor at Jawaharlal Nehru University. “Welfare schemes are targeted towards the poor but the question is whether this (free goods) is how we want to reduce inequality. A better way would be to increase the incomes of the poorer section through higher economic participation."
India’s economic growth is seen as resilient but may have left behind a significant section of the population in need of being acknowledged, even as political leaders and economists debate how to make welfare work.
Corrections and clarifications: This article has been updated to state that the bottom 10% in urban Kerala and Haryana spend around one-eighth of what the top 10% spend. An earlier version put the figure at ‘less than one-twelfth’.

