

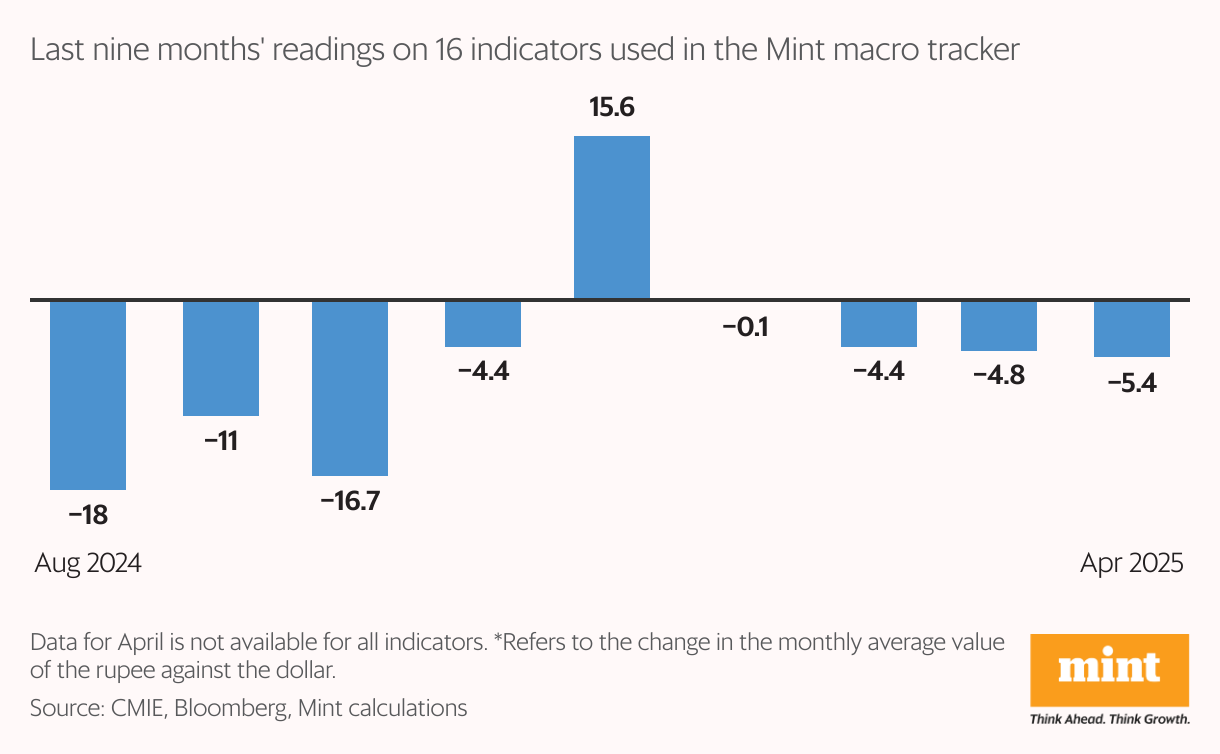
Indian economy lost momentum in April after a strong show in March: Mint tracker

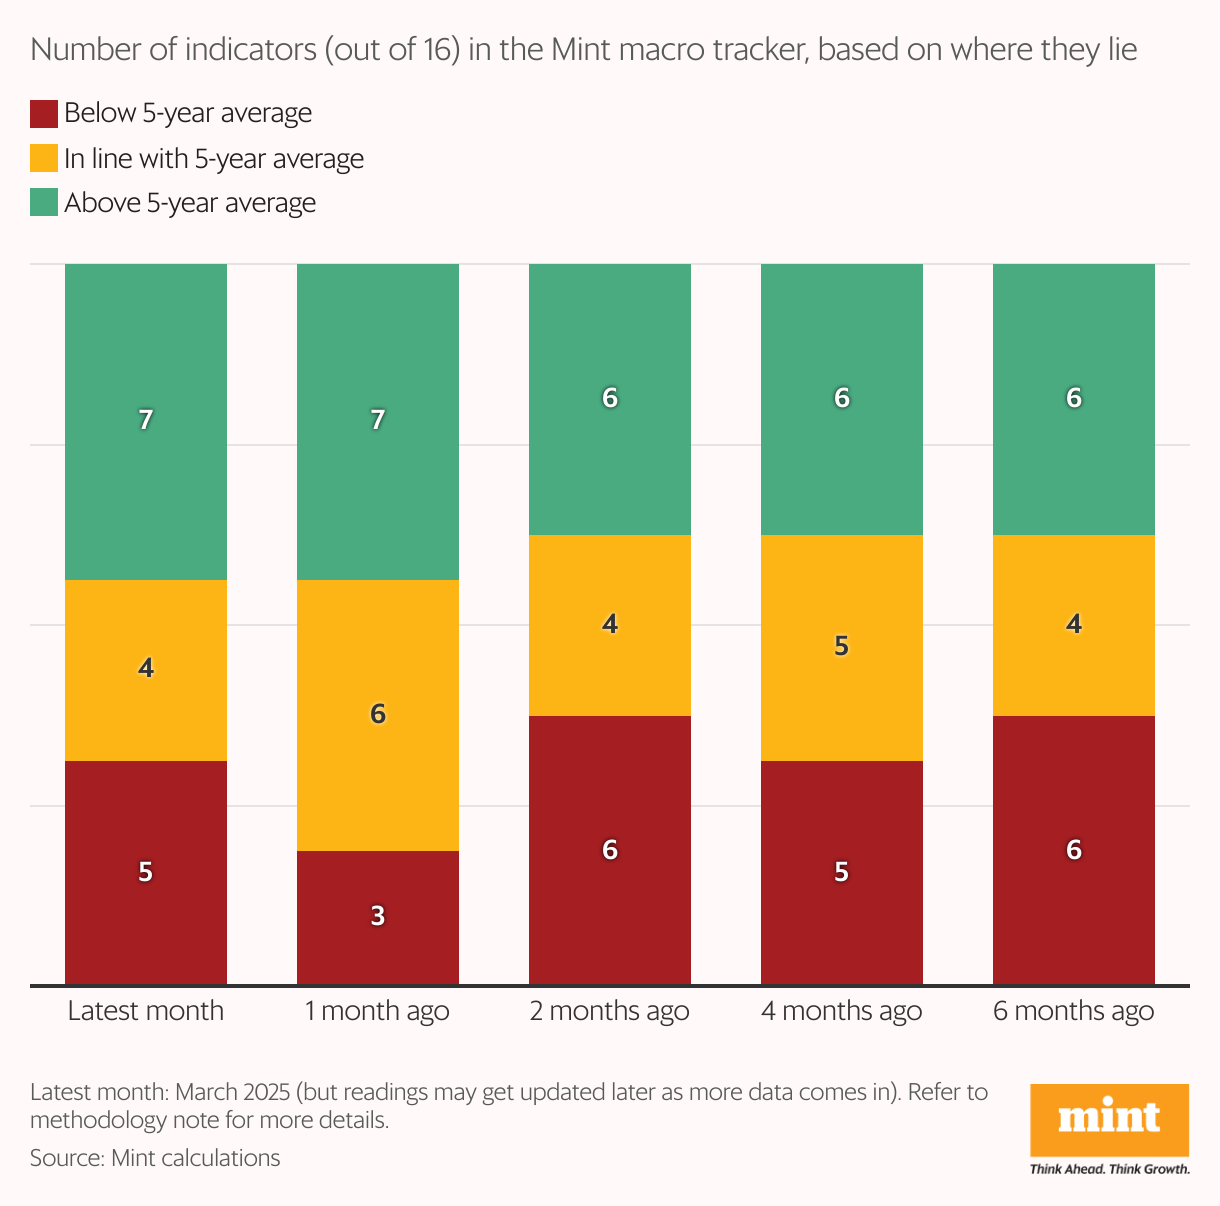
Of the 16 high-frequency indicators tracked by Mint, five were in the red compared to three in the previous month, signalling some weakness.

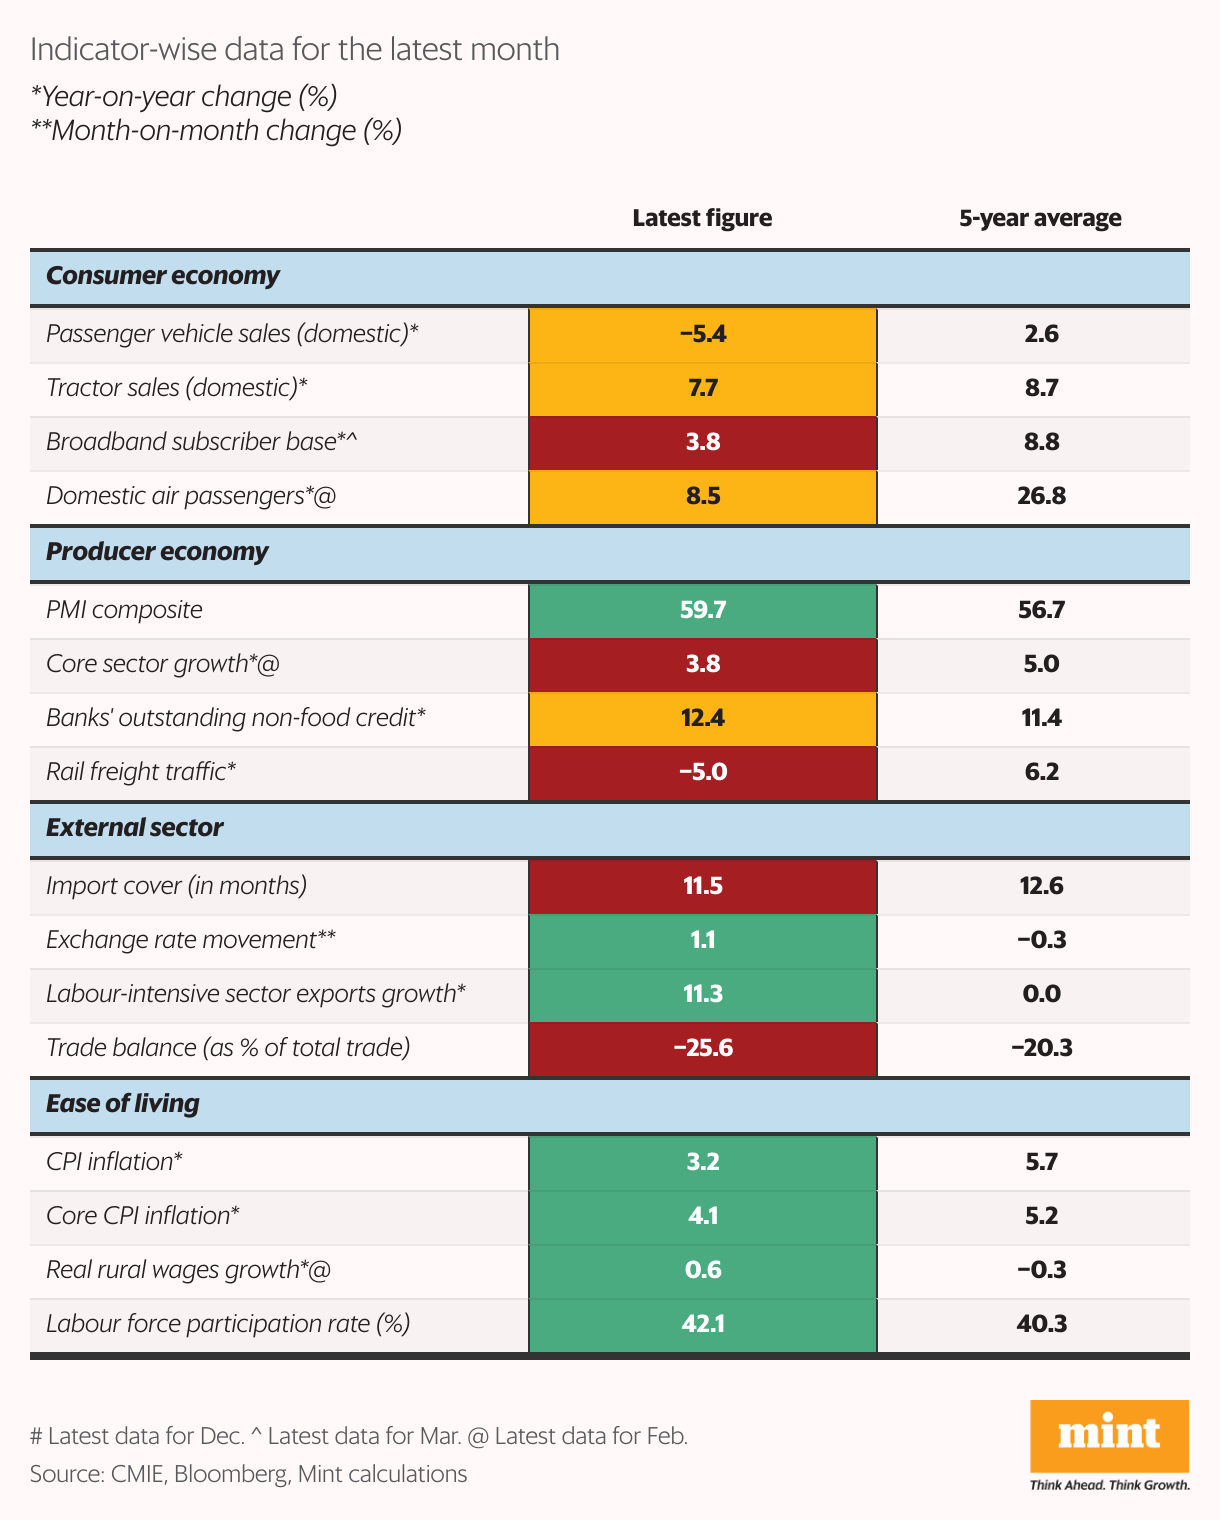
The Indian economy experienced some weakness in April compared to the previous month, showed the 16 high-frequency indicators tracked by Mint in its monthly macro tracker. Muted growth in the core sector and deterioration in the trade balance weighed on the economy's overall performance.
Seven indicators remained in the green—unchanged from the previous month—while those in the red increased to five in April from three in March. For each indicator, the value in each month is assigned a colour coding (red, amber or green) to denote where it lies relative to the five-year average (red denotes worse, amber denotes in line, and green denotes better).
Also read | The safe-haven shake-up: Euro steps up, crypto moves in
Sector-wise performance
The external sector, which was weighing on the economy's overall performance, showed some improvement in April. While import cover remained in the red, the rupee and labour-intensive export growth improved. However, the trade balance moved from amber to red.
Meanwhile, the consumer economy is finding some stability, but there hasn’t been much change in the past six months. The producer economy also hasn’t improved, with core sector performance worsening in April, moving from amber to red.
The ease-of-living segment—covering retail and core inflation, real rural wage growth, and labour force participation—continued to perform strongly, with all four indicators remaining in the green for the fourth consecutive month.
Also read: Big Four feel the heat as promotions drop, clients tighten purse strings
Mint's macro tracker provides a comprehensive monthly report on the state of the economy based on trends in 16 high-frequency indicators. The tracker has been running since October 2018.
Methodology note: While calculating the five-year average, data for some indicators for April-May 2020 and April-May 2021 have been removed to eliminate lockdown-induced skews in the trend. However, the five-year averages may still show high figures due to a sustained base effect in several indicators in 2021 and 2022.
Monthly standings will be updated retrospectively as more data comes in.
For inflation, the red/green coding is reversed.
Also read | GST mop-up: The signals for India’s economy & taxes

