

What data tells us about births and deaths in India, in 5 charts
")
The government’s latest SRS data, released after a delay, confirms excess deaths in 2021. Mint breaks down what it says about India’s births, deaths, and shifting demographic patterns.

On 7 May, the government released the much-awaited Sample Registration System data for 2021, after a gap of three years as opposed to the usual much shorter gap, which offered a glimpse into the key trends in births, deaths, fertility, and gender ratio, among others.
An earlier Mint explainer explored ‘excess deaths’ in India in 2021, a year which saw a devastating second wave of covid. Beyond the excess deaths, the report also shows a decline in life expectancy in the latest period and a rise in respiratory infections as a cause of death, both of which may be linked to covid. At the same time, the report also reveals improvements in several indicators related to births. The report is based on an annual sample survey, which comprised a population of around 8.4 million in 2021.
Mint explores these aspects in five charts:
Life expectancy: shorter
For the first time in five decades, life expectancy at birth declined in India on a five-year moving average basis in 2017-2021. According to the latest report, total life expectancy declined to 69.8 years in 2017-21 from 70.0 years in 2016-2020.
The decline can be explained by the excess deaths, nearly 2.1 million more than what was expected based on past trends, in 2021. Notably, the decline was seen among the male population, with their life expectancy reduced to 68.2 years in 2017-2021 from 68.6 years in 2016-2020.
Also read: In charts: Why a good pulses output is an urgent need this year
On the other hand, life expectancy among females, which is already higher than males, continued to rise to 71.6 years from 71.4 years. While India has seen a healthy rise in life expectancy—barring the recent decline—over the years, the country is still behind its key emerging market peers like China (78 years), Malaysia (77 years), Brazil (76 years) and Thailand (76 years), as per World Bank data.

Causes of death: many
The covid pandemic may have caused a rare increase in deaths due to respiratory infections in 2019-21, but heart diseases remained the biggest cause of deaths in the country.
Deaths due to respiratory infections surged to 9.2% of the total deaths in 2019-21 compared to 3.6% in 2017-19 (a pre-pandemic period). At the same time, deaths due to heart diseases not only remained the biggest cause but also witnessed an increase in share during the period, with their share rising to 30.2% in 2019-21 from 28.9% in 2017-19.
While non-communicable diseases such as heart disease, cancer, and diabetes led to a majority of deaths (54.9%) in 2019-21, communicable diseases such as respiratory infections and fever of unknown origin witnessed an increased share of deaths in 2019-21 at 23.9%, compared to 21.5% in 2017-19.
Among the 10 biggest categories of death causes, diabetes ranked seventh in 2019-21, even though it was not among the top 10 in 2017-19, signalling an increased danger from the disease.

Gender ratio: mixed gains
India’s sex ratio at birth—the number of females per 1,000 males—rose to 913 in 2019-21 from 898 in 2014-16, marking a steady but encouraging trend in achieving gender balance in the demographics. Among the states, Kerala had the highest sex ratio of 962, while Uttarakhand (852) and Delhi (863) were at the bottom.
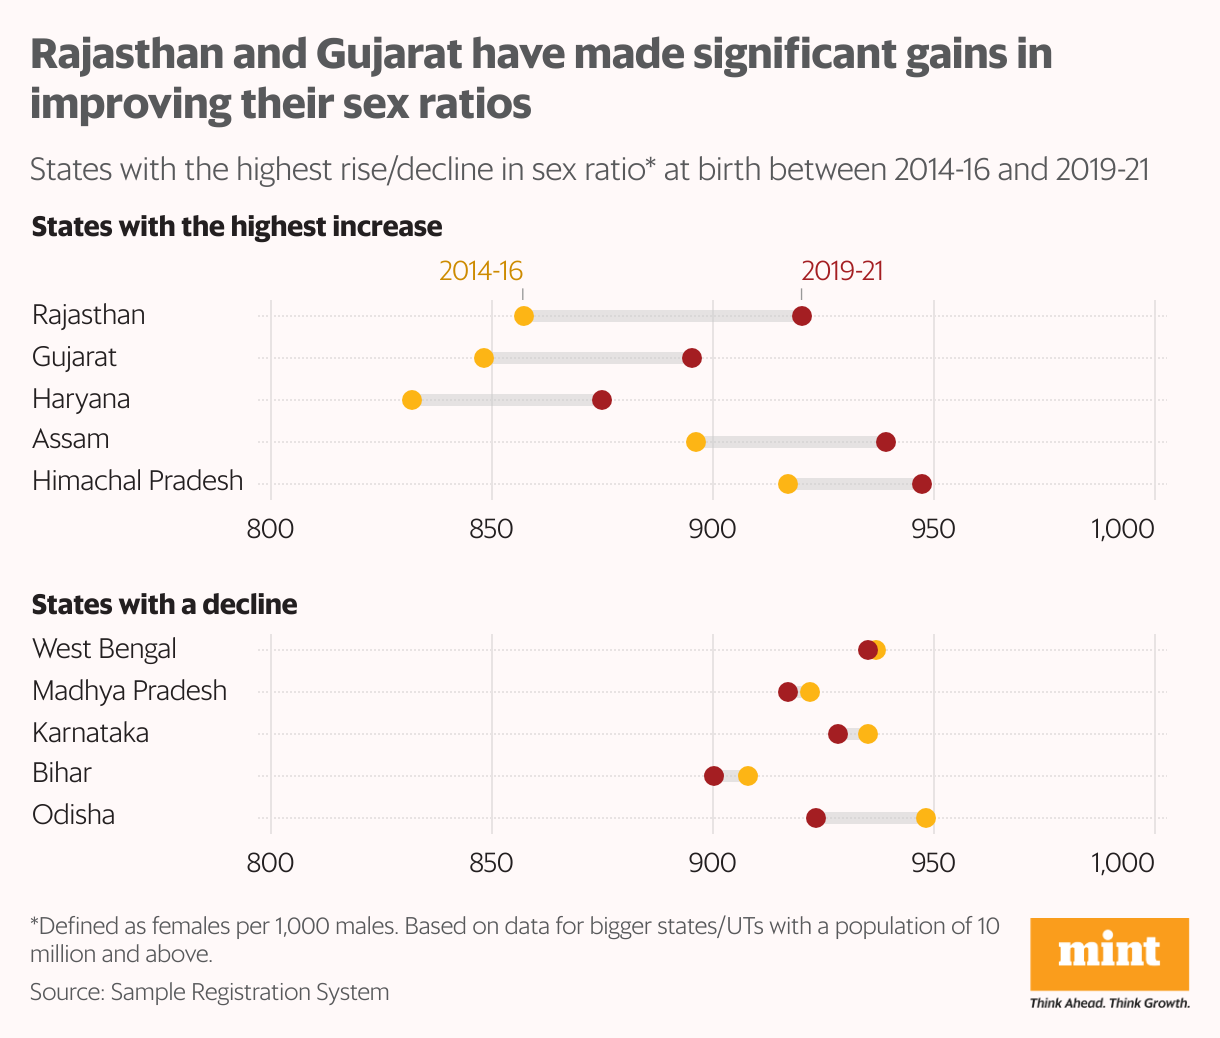
A further analysis showed that some states with historically low ratios, like Rajasthan, Gujarat and Haryana, saw a sizeable improvement in 2019-21 compared to 2014-16. From 857 females per 1,000 males in the five-year-ago period, Rajasthan witnessed the ratio rise to 920—putting it above the national average and lifting its rank to 11 from 18 earlier.
At the same time, some states, particularly Odisha, witnessed a decline in the gender ratio, giving mixed signals on the progress made so far. Among the 22 states and union territories with a population of 10 million or more for which data were given, six had a gender ratio below 900.
Also read: In charts: Young Indians are patriotic and progressive, but politically disengaged
Birth gap: on track
Most Indians are choosing to have a gap of three years or more between two live births, signalling better family planning and greater awareness over the health of the mother.
The data showed that in 2021, 52.4% of live births to couples came three or more years after the previous birth. This is an increase from 51.9% five years ago. (Note that this counts only second or higher-order live births; the first birth to a woman is not counted.) In 2011, only 42% of Indians had three or more years of gap between two live births.
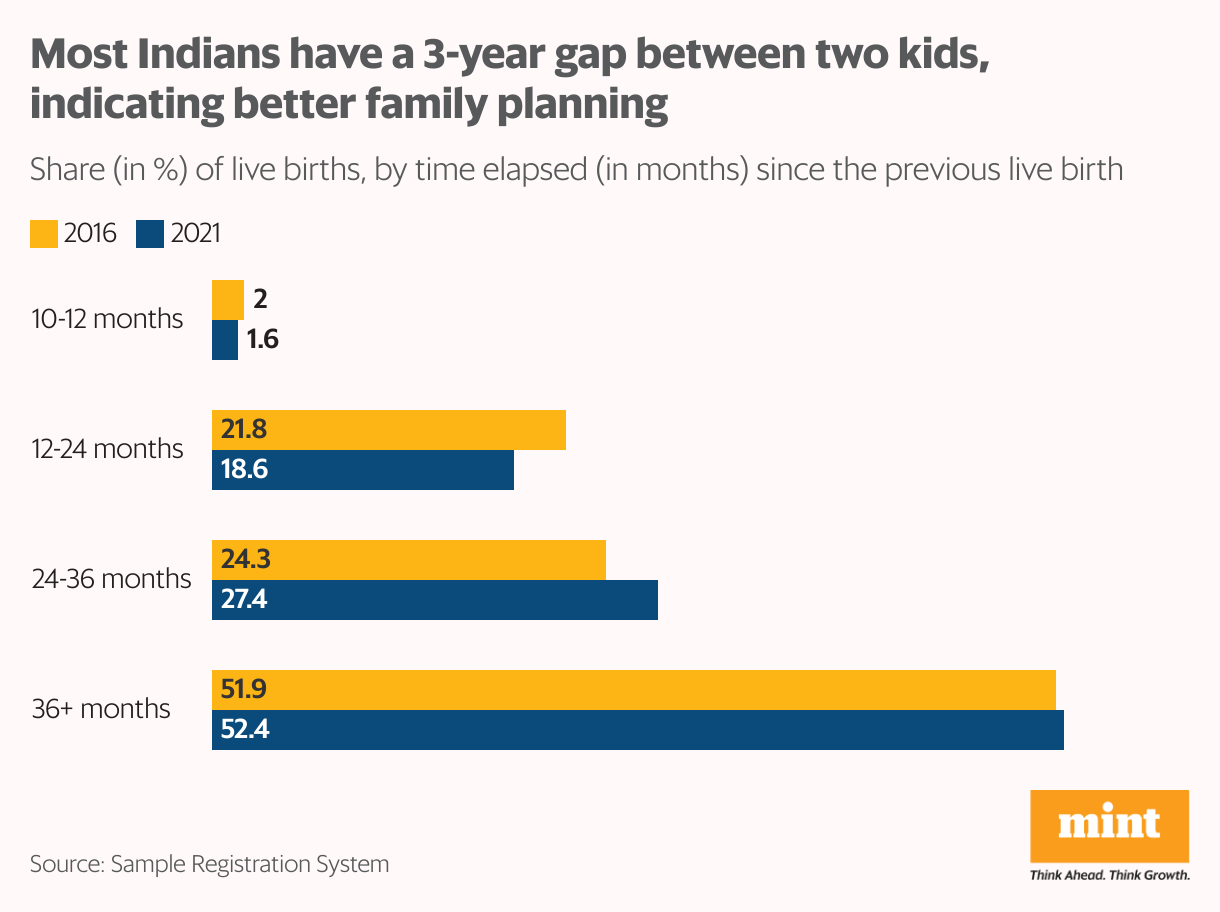
However, a sizeable proportion of second or higher-order births to Indian couples (nearly 25%) continued to come less than two years after the previous birth. Among states, Madhya Pradesh had the lowest percentage (35.3%) of births with three or more years of spacing, followed by Bihar (44.8%).
Childbirths: more formalized
Institutional births, which involve giving birth at a medical facility under the supervision of trained healthcare professionals, have gone up over the years.
Data showed that over 90% of births were institutional births in 2021, up from about 80% a decade ago. This was led by a sharp increase in births at government hospitals, whose share increased to 66% in 2021 from 45% in 2011.

Government hospitals were more prominent in rural areas, with 68% of births as opposed to about 60% in urban areas. Among the states, government hospitals were more prevalent in Jammu and Kashmir, while private hospitals were more prevalent in Kerala.
As better care and more professional help became available to women during pregnancy, the maternal mortality ratio came down to 93 per 100,000 live births in 2019-20 from 130 in 2014-16. Similarly, the infant mortality rate declined to 27 per 1,000 live births in 2021 from 39 in 2014.
Also read: How covid transformed tech and where challenges persist, in five charts

