 Industry
Indians may have saved more in FY24. Is the rise sustainable?
")
Summary
- After a decade-long decline, savings by Indian households—held as cash, real estate, mutual funds, gold, etc—may pick up. But unless a deeper malaise is addressed, this rise may not sustain. What exactly is the underlying issue the new government at the Centre has to tackle? Read on.
New Delhi: If economic analysts are proved right, Indian household savings could see a revival. For more than a decade now, financial savings of Indian households—held as cash, or invested in bank deposits and other financial instruments—have seen a steady downward trend, from 7.4% of gross domestic product (GDP) in 2011-12, to 5.3% of GDP in 2022-23. The latest GDP statistics show that India’s GDP grew by 8.2% in 2023-24.
While the GDP data doesn’t break down savings by households, investment bank Goldman Sachs had predicted this share would increase to 6% of GDP for 2023-24. Ratings agency Crisil, too, had predicted that household savings could see an uptick. “The slowdown in private consumption in fiscal 2024, despite GDP growth, also hints at households raising savings," it says, concluding: “Households account for a lion's share in domestic savings, and early indicators suggest a pick-up in this savings category in fiscal 2024." The rating agency points to annual growth in private consumption (in nominal terms) slowing sharply from 14.2% in 2022-23 to 8% in 2023-24.
If households are saving rather than spending the income they earn, this is not necessarily the best thing for the overall economy, other things being equal. But, even if households saving more and consuming less is desirable as these savings provide funds for companies to invest, can they sustain this?
From Saving to Borrowing
The chart below shows what many economic analysts have been concerned about. The national savings rate, which includes savings by households, companies and government, declined by about 5 percentage points between 2011-12 and 2022-23, to 30%. For 2023-24, it is likely to be slightly above 31%.
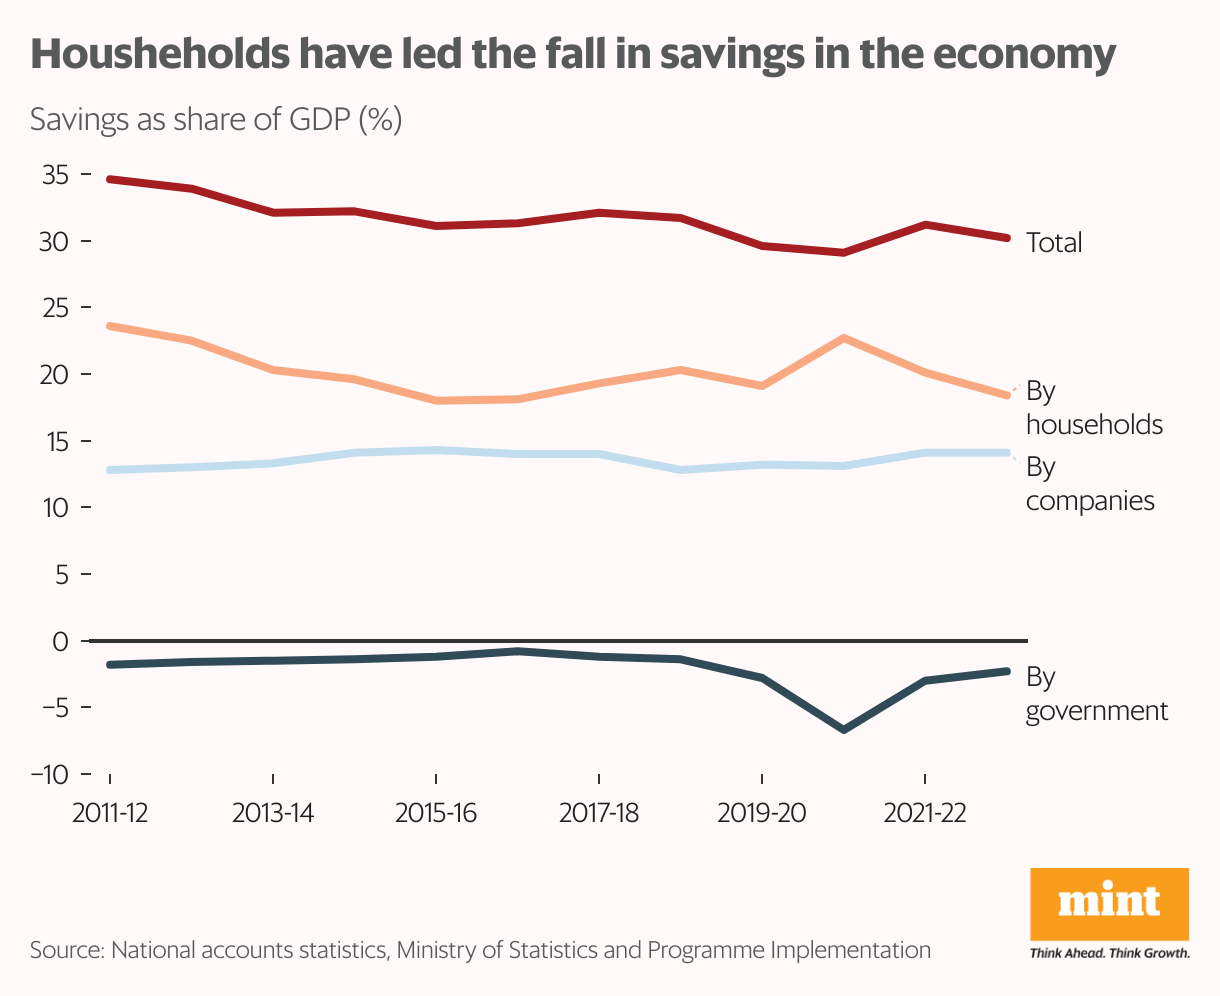
Typically, it is the savings of households (financial savings, real estate and investments made in precious metals) and companies that fund government deficits. As the numbers show, the extent of corporate savings as a share of GDP, and the extent to which governments spend more than they earn (as a share of GDP), have remained relatively constant over the last decade. It is household savings that have driven much of the fall in the national savings rate, going from about 24% of GDP in 2011-12 to 18% in 2022-23.
Barring the covid-19 era, household savings have historically accounted for the bulk of savings in the economy—usually of 60-65% in the last decade.
Accompanying this decline has been a set of changes in the way households have actually saved. The government collects data on ‘gross’ household financial savings invested in the form of currency, bank deposits, shares, mutual funds, provident funds, etc. It also collects data on household financial ‘liabilities’—broadly, the amount that households pay in interest and principal on loans every year. There are two other categories of household saving: investments in physical assets such as real estate, and in the form of precious metals such as gold.
The first big shift in household finances over the last decade has been household debt. Households are borrowing more from banks to buy houses, cars and other items of consumption. “The rising proclivity for debt among households is fanned by a clutch of tailwinds—a retail credit push by lenders, greater appetite for borrowings, especially among the young, and improved access to lenders owing to advances in technology," points out Crisil.
Total retail credit (of banks and non-bank finance companies), according to Crisil, rose to 19.4% of GDP in 2022-23 and is projected to rise further to 23% in 2023-24, from 12.1% of GDP in 2016-17. Over 2022-23 itself, the total stock of household debt rose 73% from the previous year, an increase of ₹15.57 trillion.
The chart below shows retail credit growth (in year-on-year terms, for banks only) growing at over 30% as of December last year.
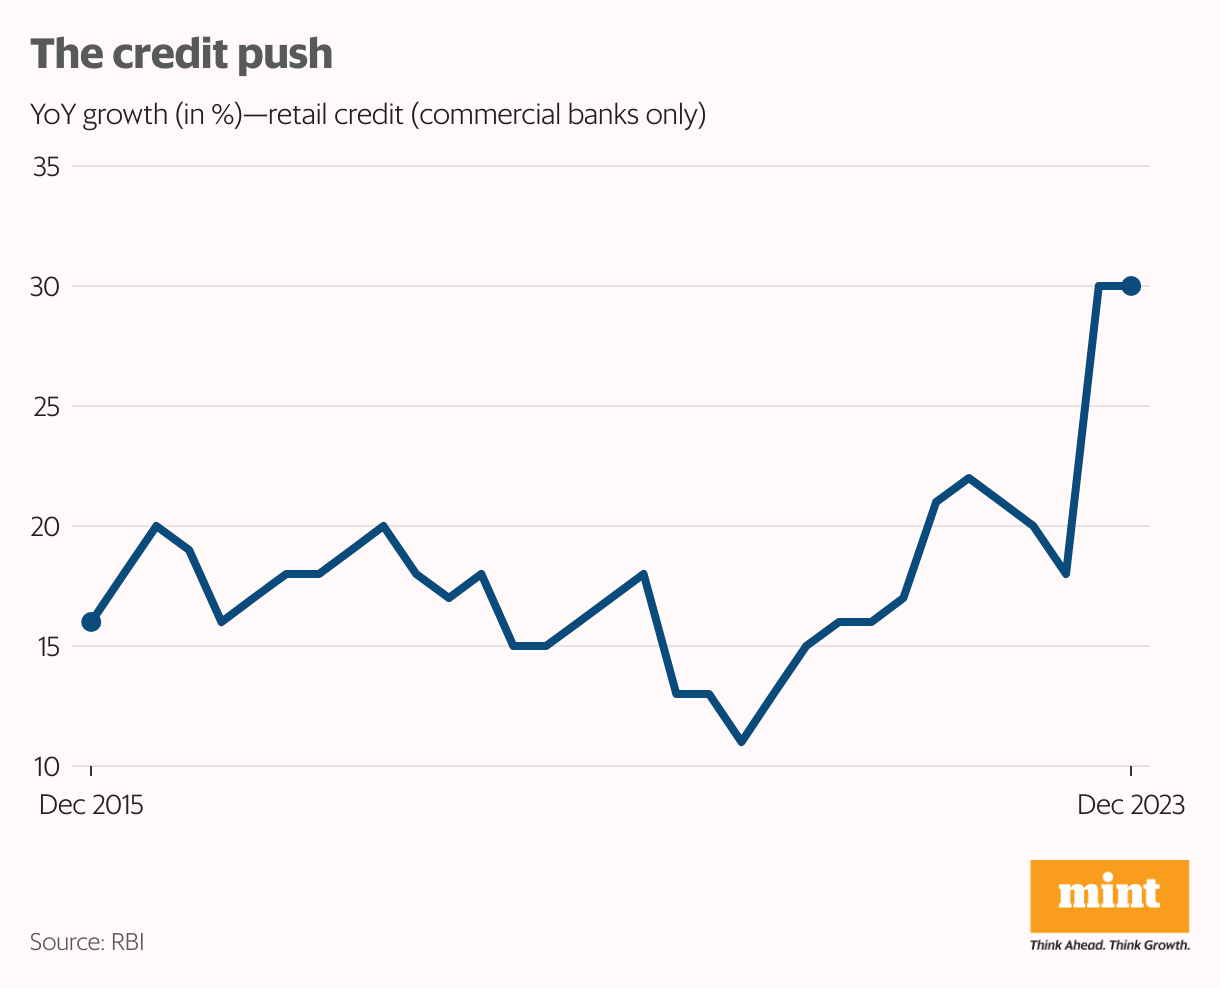
Throughout most of the last decade, corporate borrowing was sluggish at best, with banks souring on lending to the sector in the aftermath of the 2008 financial crisis. Loans to households began to take the place of corporate lending as a major growth area for banks. The introduction of credit bureaus made it easier for banks to assess the creditworthiness of borrowers.
As Crisil points out, even as home loans still account for the bulk of retail lending, their share in overall retail loans has declined by about 6 percentage points since 2017. At the same time, the share of credit cards, vehicle loans and other personal loans has increased. In other words, households are increasingly taking on debt not to buy houses, but for more short-term needs and for assets that depreciate over time.
Portfolio Diversification

The second big shift was towards holding financial savings in different types of assets. Ten years ago, close to 70% of household financial savings were held as cash or invested in deposits with banks or finance companies. That share has now fallen to well below half. Investments in provident and pension funds and ‘small savings’ account for a bulk of the shift. Investment in shares or mutual funds as a proportion of financial savings, too, has grown, though it remains within single digits as a share of the total household savings pie.
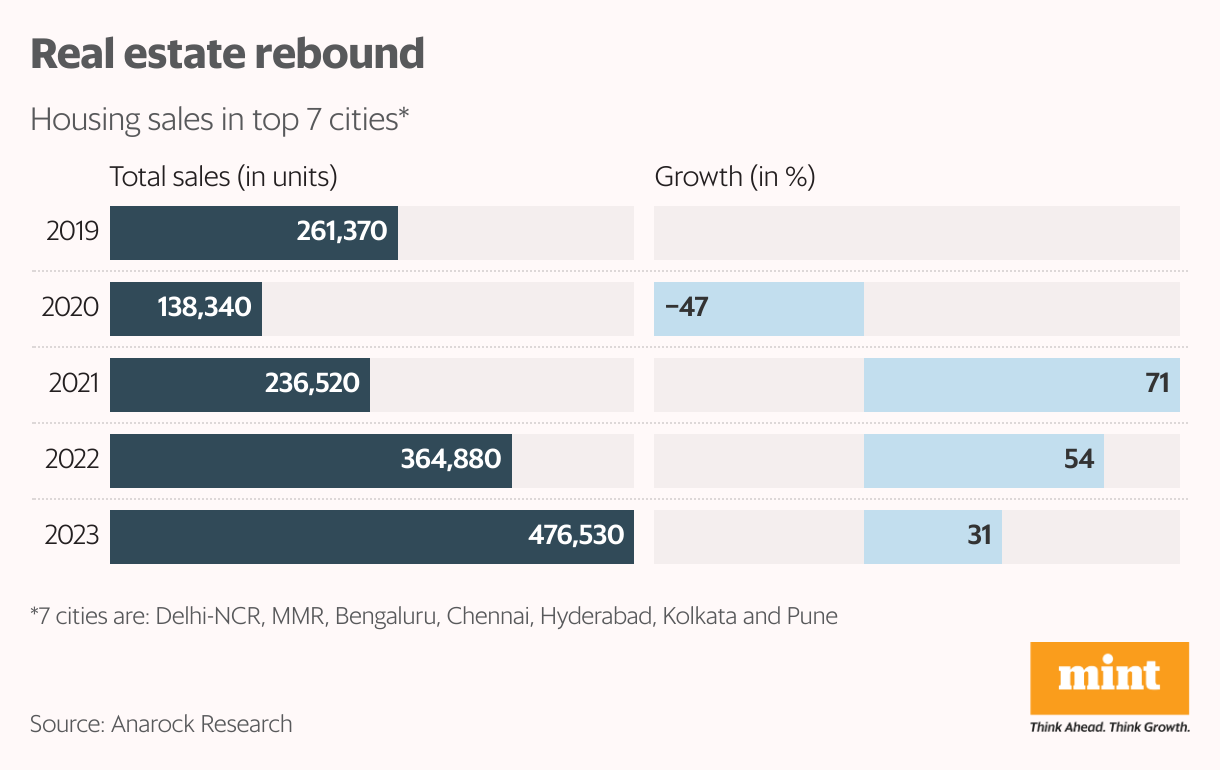
The third big shift has been an increase in so-called ‘physical’ savings, such as investments in real estate. While this has always been an important component of household saving, it declined from a high of 67% of total household savings (in net terms) at the beginning of the last decade to about 57% in 2016-17. It slowly began to creep back up and now accounts for around 70% of household savings. Indeed, to an extent, the increase in physical savings (in areas like real estate), and the increase in household financial liabilities are a mirror of each other—as a household takes a loan to buy a house, it reflects in an increase in that household’s stock of physical assets, and an increase in that household’s indebtedness.
The fourth and final shift has been the decline in household savings invested in gold or other precious metals, from about 16% in 2011-12 to about 13% in 2022-23. For decades, policymakers have been obsessed with Indian households’ fascination with gold and made numerous attempts at getting Indians to dislodge those savings so as to be able to direct them toward ‘productive’ uses, often ignoring the fact that Indian households had a very good reason to hold on to gold, especially in times of economic uncertainty and inflation. It’s likely that the growth of gold loan companies has finally freed up some of the savings in the yellow metal and helped direct them toward the broader economy. It’s not clear, however, whether this trend will sustain itself in the long term.
More Jobs, Higher Incomes

In the short term at least, it is likely that household financial savings, net of interest or principal payments on debt, are likely to rise, as both Goldman Sachs and Crisil predict. This is because such payments shot up by two percentage points in the space of one year. It’s likely that a combination of households taking on more debt due to income being hit by covid, and rising interest rates, meant household debt payments rose. If this is the case, then as the economy normalised further in 2023-24, the buildup of household debt could slow.
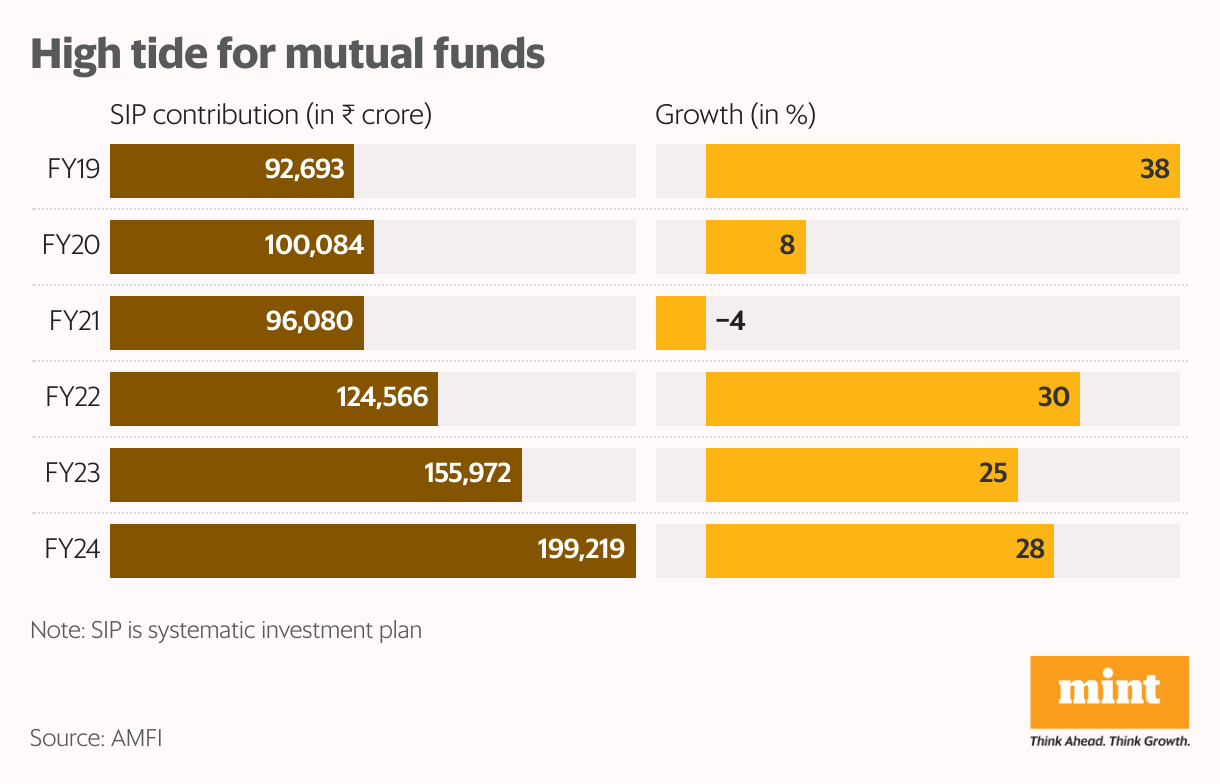
A faster pace in growth of deposits, combined with a slower growth in retail loans in 2023-24 makes this more likely, freeing up more money for households across the economy to save, and be channelled toward economy-wide investment. Further, as Crisil points out: “Mutual fund investments by households have grown at a faster rate in fiscal 2024 compared with the recent past. Investments through systematic investment plans (SIPs), mostly opted by individuals in the country, continued to rise in fiscal 2024."
But will this increase in household savings be sustained for the longer term? Is it likely that we will see household savings, in overall terms, creep back up to levels of a decade ago?
In the longer term, the only way households collectively will save more is if a larger number of household members are able to find stable, well-paying jobs, and if their income levels rise enough to be able to enable them to put money away in the bank, after taking care of necessities.
But as the chart below shows, the share of GDP in each year that finally ends in the hands of households has declined by over 10 percentage points since 2002-03. In fact, through the 1990s and early 2000s, the share of GDP accruing to households remained well above 80%. It was toward the mid- and late-2000s that the household share of GDP began to decline. In 2022-23, it hit its lowest level ever, since at least 1981, of 71% of GDP.
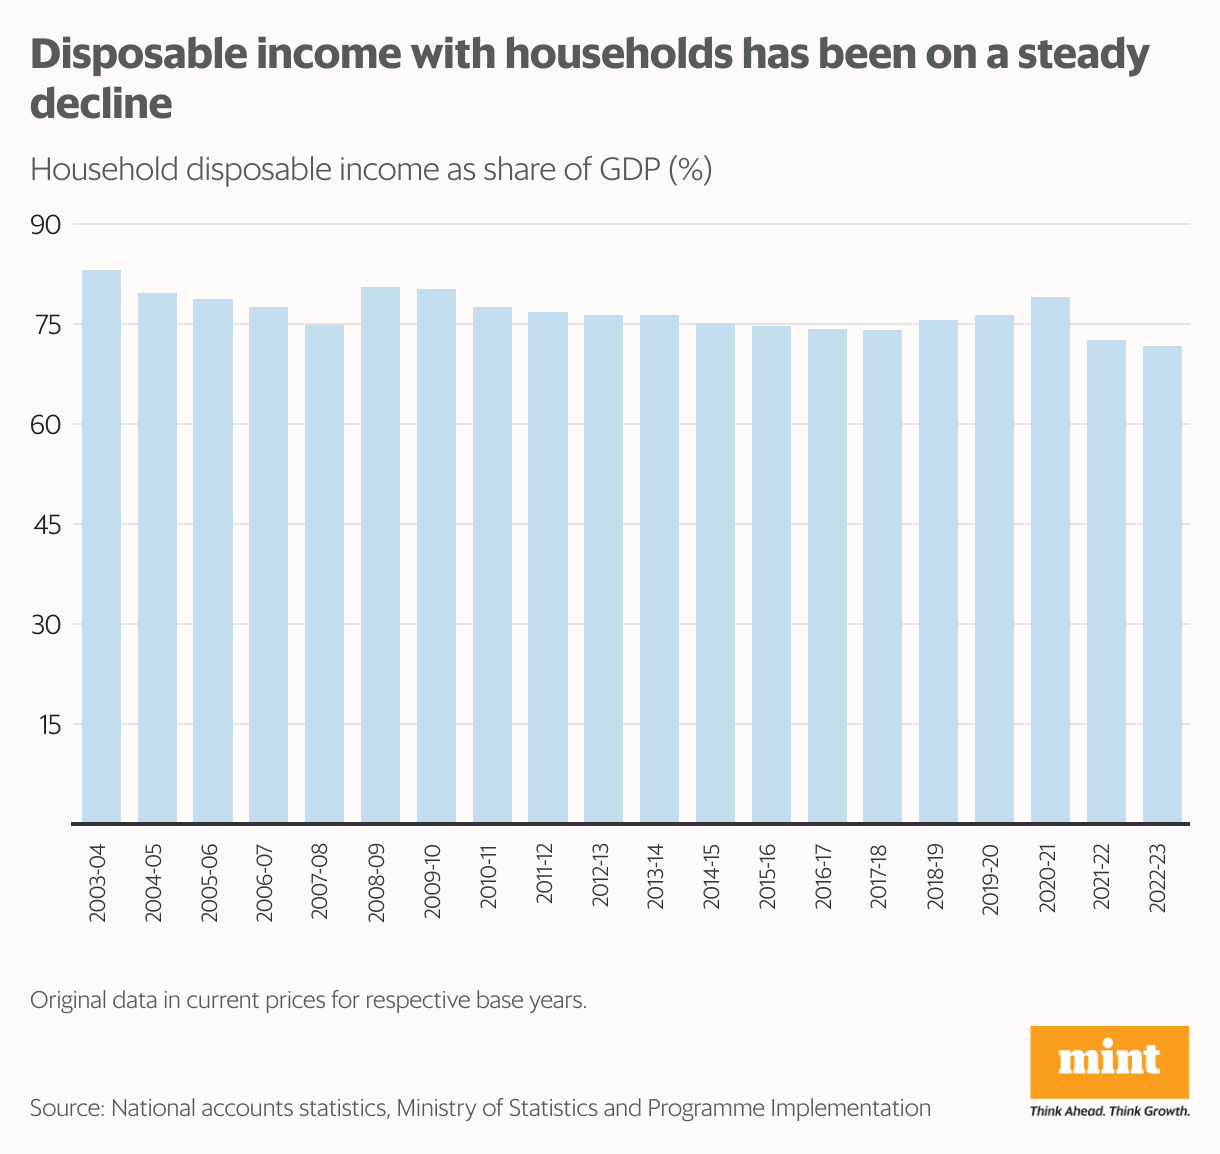
The so-called ‘household disposable income’ computed by government statisticians is calculated by taking overall GDP numbers and netting out profits of companies, and the corporate and personal income taxes that governments claim. In effect, household incomes are growing at a slower pace than that of the economy as a whole.
Even worse, though, is employment growth. It’s now clear that since at least the early 2000s, employment has grown slowly, if at all. As the India Employment Report 2024, produced by the Institute for Human Development and the International Labour Organization points out, between 2000 and 2012, employment grew at an average rate of 1.6%, while ‘gross value added’ (a measure of GDP), grew at 6.2%.
This trend actually worsened between 2012 and 2019—employment growth was 0.01% while output grew at 6.7% per year. Essentially, the whole of the last decade was one of jobless growth. It was only during the covid years that employment recovered, and overall employment grew at a faster pace.
But even this ‘improvement’ has to be qualified. “During the covid-19 pandemic, the youth labour market indicators worsened only during peak periods. After the lockdowns, the youth labour market indicators recovered quite quickly. But this movement was accompanied by additions to the labour force and workforce, primarily in poor-quality work. The number of youths in self-employment expanded much more than in other categories of employment during the pandemic, which was mostly in household unpaid work, especially among rural women and considered the worst form of employment. Additionally, the number of young workers engaged in regular salaried jobs declined during the pandemic period," the report pointed out.
And even among salaried workers, wage growth has been muted or non-existent. According to the report, monthly real wages for salaried workers actually declined between 2022 and 2023. “Over the past decade, the average monthly real earnings of regular salaried and self-employed persons either declined or remained stable," adds the report. “The declining real earnings of regular salaried workers and the self-employed, along with only a small increase in real wages for casual workers in India, indicates that the quality of employment generation was poor between 2000 and 2022."
Thus, the real problem with India’s household savings shortage is really this: a lack of employment, and stagnant wages. Until and unless these bigger issues are fixed, any uptick in savings will only be temporary.
howindialives.com is a search engine for public data


