
Decoding today's market crash in charts: The hard truths you need to know alongside signs of resilience

- Grasping today’s crash means charting the landscape of damage while noting unexpected islands of market strength.

India’s equity market registered its sharpest single-day fall in 10 months on Monday after US President Donald Trump’s tariff tantrums roiled investors globally over the weekend. But a Mint analysis suggests the Monday blues needn’t necessarily signal a prolonged period of doom and gloom, and, in fact, there could be some sectoral opportunities lurking around the corner.
The benchmark Sensex index opened Monday almost 4,000 points lower, and plunged nearly 3% during the day, as fears of an extended trade war and heightened near-term volatility gripped D-Street.
Mint’s analysis showed that following the day’s crash, Indian equities had logged the worst monthly advances-decline ratio over the past year. The Nifty Midcap 100 and Nifty Smallcap 100 indices also witnessed heavy selling pressure, and declined 3.5% and 3.8%, respectively.
The market crash wasn’t unexpected, though. Traditionally, markets tend to be on edge at the start of a week following turbulence from the previous week or weekend. Global markets were already reeling under Trump’s sweeping reciprocal tariffs on more than 60 nations, with China’s 34% retaliatory tariffs on US goods adding fuel to the fire.
Also read | Global and Indian markets crack under Trump’s tariff shock—what this means for investors
The tradition of Monday blues
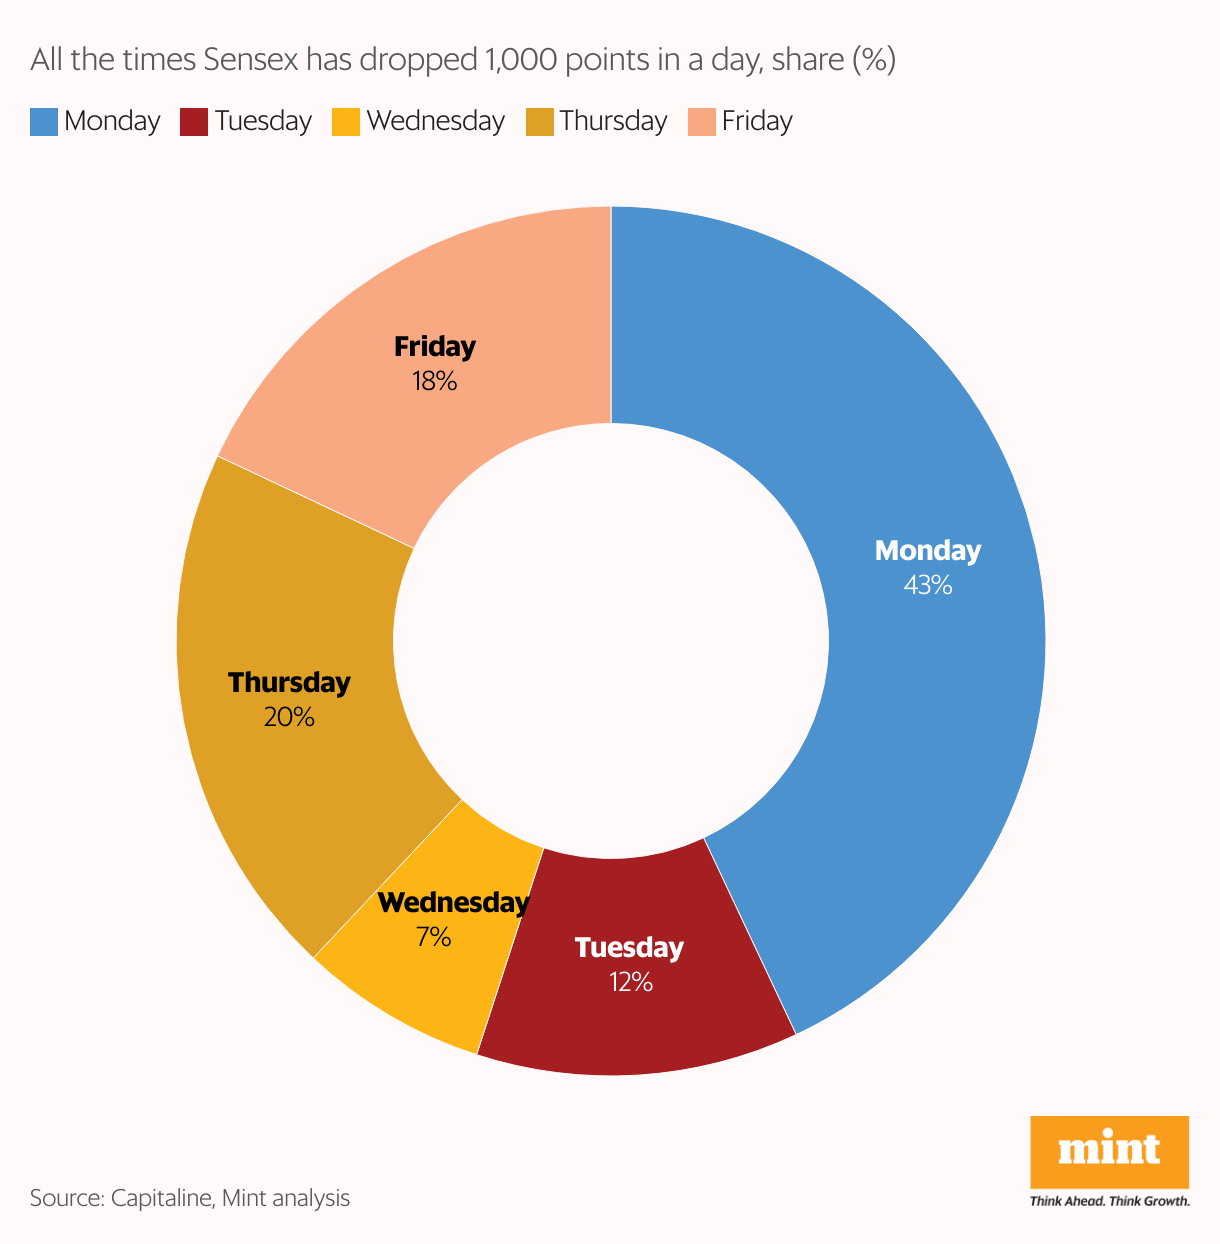
Mint’s analysis confirmed this bitter relationship between markets and Mondays: 43% of the worst Sensex crashes (falls exceeding 1,000 points) and over half of the top 20 single-day declines have occurred on Mondays.
“Today’s sharp correction is largely a spillover from global concerns rather than domestic fundamentals," Abhishek Jaiswal, fund manager at Finavenue, a category-III alternative investment fund, said in a note.
“While India’s direct export exposure to the US is limited, the broader implications of a global tariff regime are unsettling markets everywhere. The real worry lies in how such policy moves could fuel inflation, disrupt supply chains, and trigger a slowdown or even recession over the coming years," he added.
Fear gauge spikes
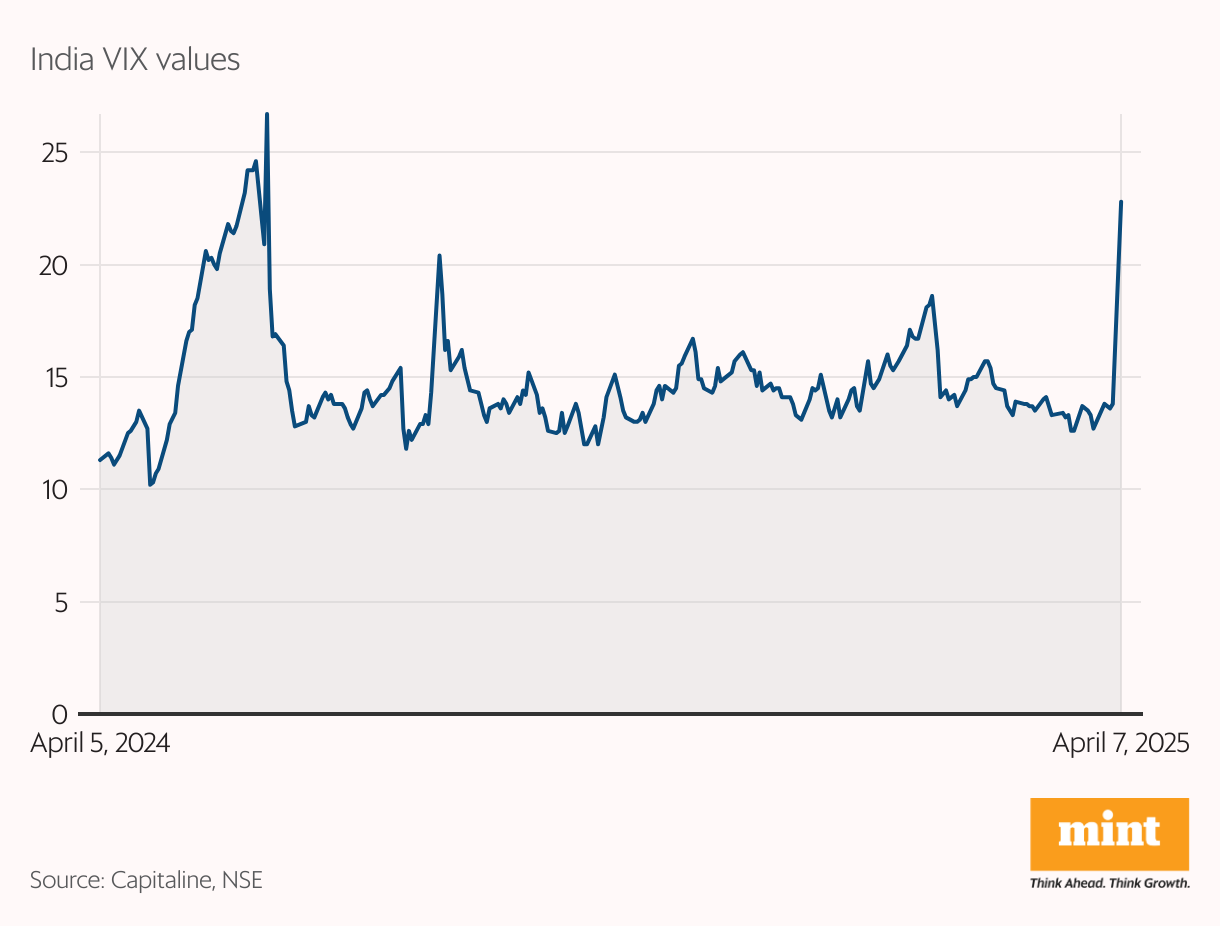
The India Volatility Index (VIX), also known as the market’s "fear gauge", surged on Monday by an unprecedented 65% to 22.8—its highest level since its launch in 2007.
India VIX measures expected turbulence in the Nifty 50 over the next 30 days. The previous time the VIX witnessed such a sharp rise was 24 August 2015, when it jumped 64% to 28.13 during a global equity meltdown amid China's trade tension and recession fears.
Also read | Black Monday: The new Don of Dalal Street
The index's dramatic spike on Monday reflects mounting panic among investors following the US government’s decision to impose steep reciprocal tariffs, including a 27% duty on key Indian exports.
Negative market breadth
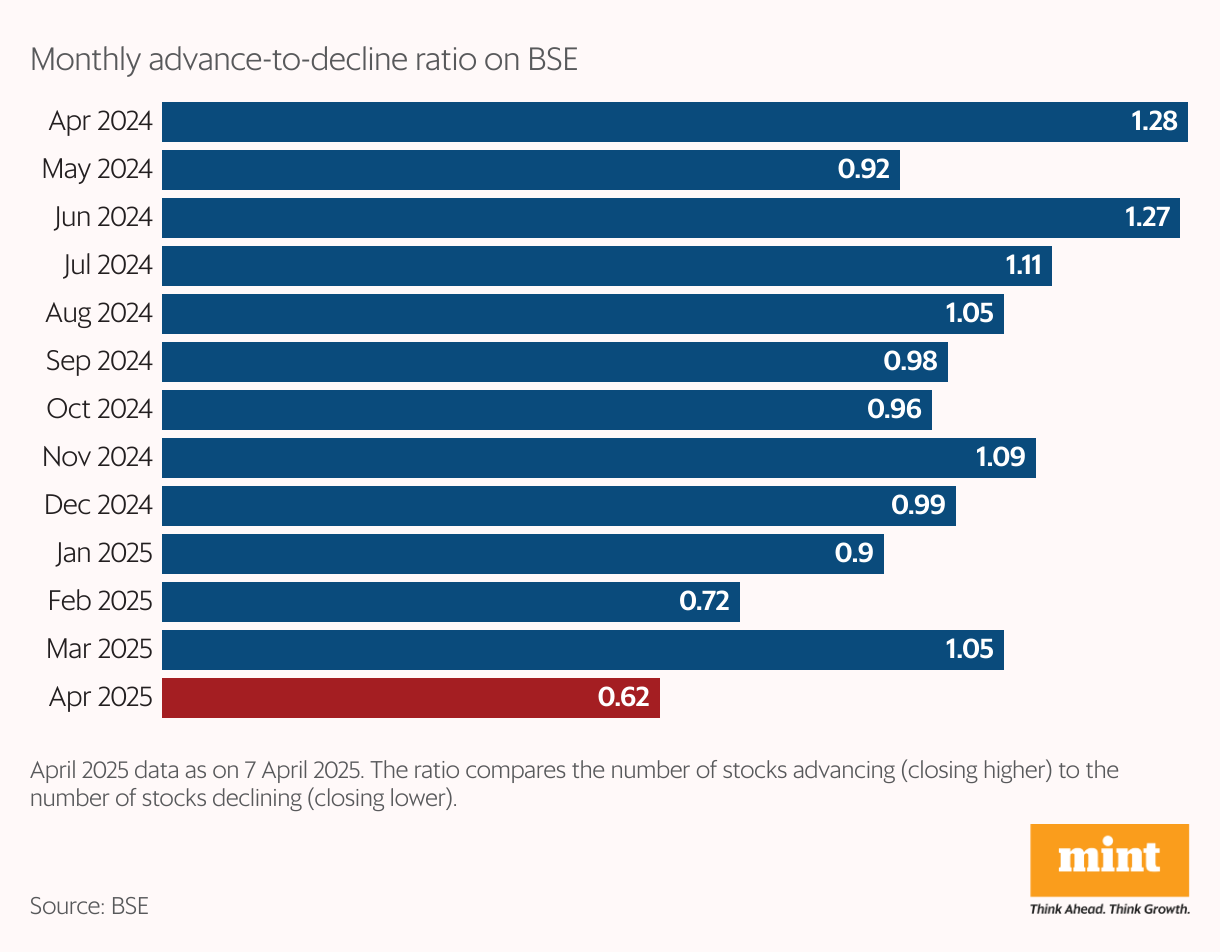
Indian equities also recorded their weakest market breadth in over a year on Monday, with the advance-decline ratio dropping to a concerning low of 0.62. This marks the worst monthly reading since at least April 2024, highlighting a broad-based weakness beneath the surface of benchmark indices.
The advance-decline ratio, a key gauge of market breadth, reflects the number of stocks rising for every one that declines. A ratio of 0.62 implies that for every 10 declining stocks, only about 6 managed to post gains—a clear signal of deteriorating investor sentiment and limited market participation in gains.
In comparison, the ratio, which stood at 1.28 in April last year, had moderated to 1.05 in March 2025. The sharp drop this month suggests that recent gains in frontline indices may be masking underlying weakness across broader segments of the market.
The paradox
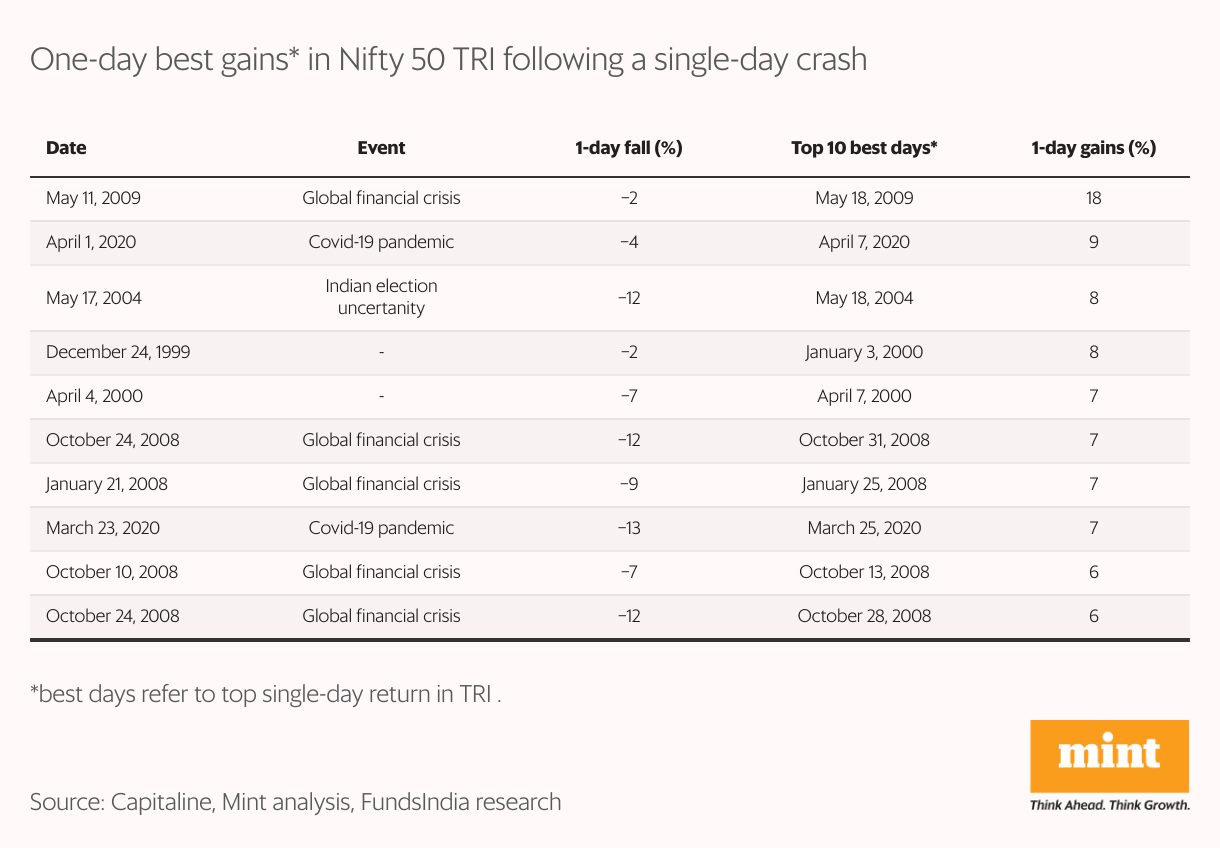
Think market crashes are all doom and gloom? Mint's analysis suggests otherwise—the best single-day rallies for the Nifty 50 Total Return Index have frequently occurred within days of its worst single-day collapses.
The takeaway for investors? The moments when the market feels utterly battered can, surprisingly, present the most fertile ground for significant gains.
Relative resilience
Moreover, India’s resilience relative to its global peers might offer further comfort to investors.
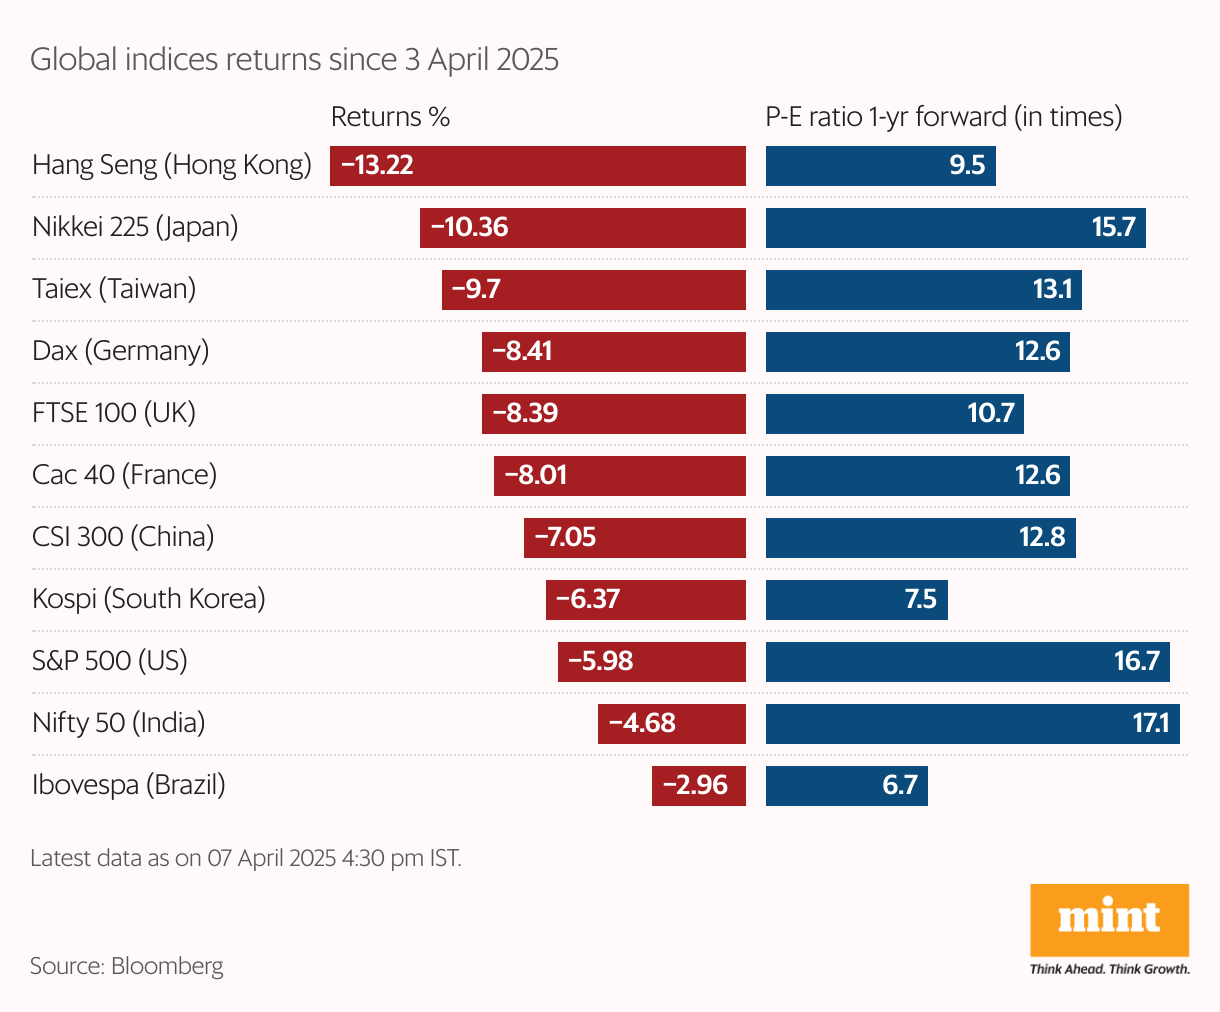
Since the announcements of reciprocal tariffs on 3 April (in Indian time), the Nifty 50 has fallen only 5% so far despite persistent foreign fund outflows, second only to Brazil’s Ibovespa index, which has fallen 3% (updated as on 4:30 pm IST). On Monday, the Nifty lost 742.85 points, or 3.24%.
The Nifty's resilience stands in sharp contrast to steeper corrections elsewhere. Hong Kong’s Hang Seng has plunged 13.22%, Japan’s Nikkei 225 has declined 10.36%, Taiwan’s Taiex is down 9.7%, and the US S&P 500 has fallen 5.98% over the past three trading sessions.
Lucrative themes
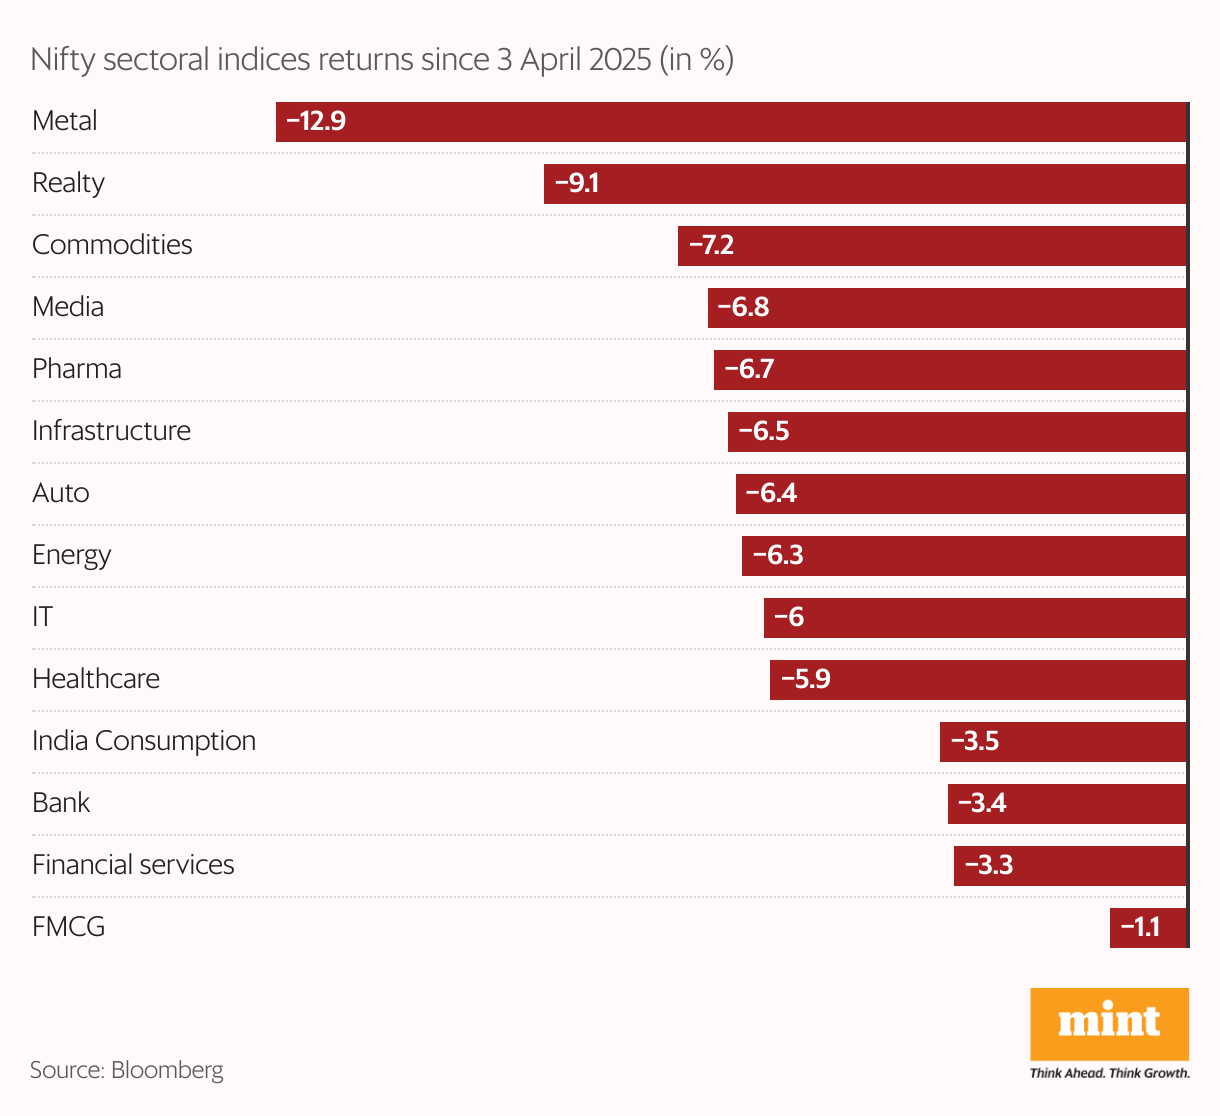
Following the market volatility on Monday, all sectoral indices were awash in a sea of red, with the metals and real estate sectors bearing most of the brunt. But the broader market corrections have made consumption-oriented and domestic-facing sectors more lucrative for investors, according to experts.
"Domestic themes like cement, building materials and consumer discretionary looks attractive from a longer-term point of view," Nilesh Shah, managing director at Kotak Mahindra AMC, said in a note.
Also read | Here are the sectoral winners and losers from Trump's reciprocal tariffs
“The tax rebate announced in the budget, EMI burden coming down due to lower rates, likely drop in oil prices and eighth pay commission to be implemented next year will support (the) consumption theme," Shah added.
In fact, the Nifty FMCG index has been the most resilient so far, losing only 1% in the last three days. The Nifty Consumption, Nifty Bank, and Nifty Financial Services indices lost only 3-3.5% in that period.
The rupee's resilience
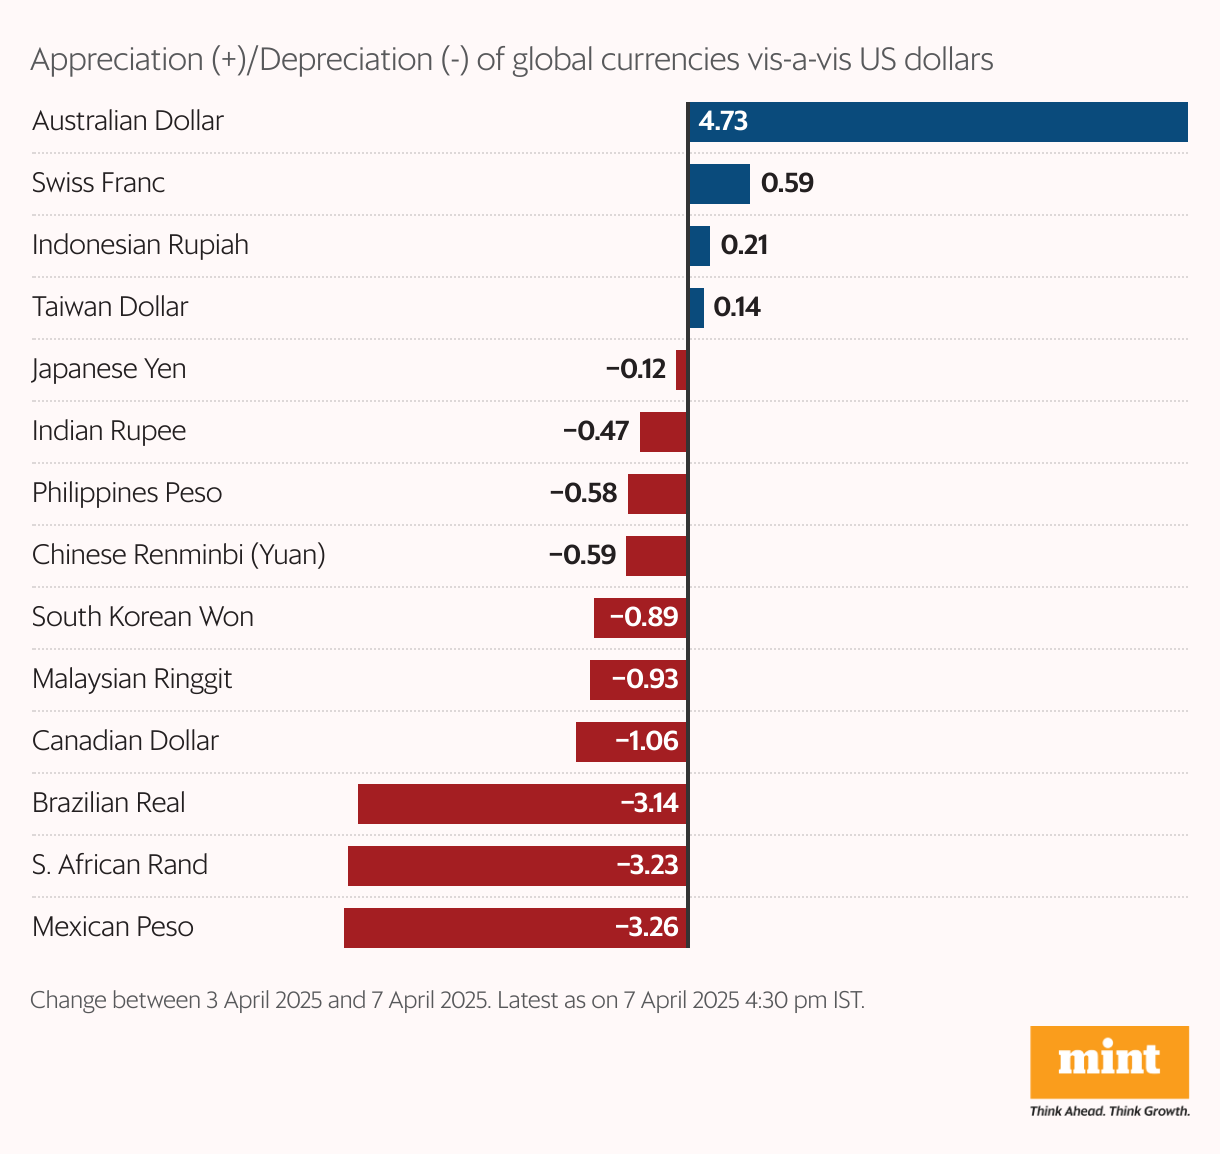
As global currencies adjust to Trump's tariff measures, several emerging market currencies have depreciated against the US dollar—potentially boosting export competitiveness. However, the Indian rupee has shown relative firmness, slipping just 0.47% between 3 April and 7 April.
The South African rand and Mexican peso have posted heavy corrections, depreciating by 3.23% and 3.26%, respectively, while the Brazilian real has weakened by 3.14%. The Chinese renminbi has declined by 0.59%.
On the flip side, some major currencies have moved against the broader trend. The Australian dollar appreciated sharply against the US dollar by 4.73%, while the Swiss franc has strengthened by 0.59%—an outcome that could weigh on their export competitiveness in the short term.
Even so, the “intensifying trade war triggered by Trump’s tariff policy weighs on the INR", said Kunal Sodhani, assistant general manager (vice president), global trading centre, FX & rates treasury, Shinhan Bank India.
“The heightened uncertainty has triggered risk-off sentiment, leading to outflows from emerging markets. DXY (US dollar index) also sharply bounced back above 103 levels, pushing USD higher against the majors," Sodhani added.
“China also had retaliatory tariffs on the US. Thus, all eyes also remain on the USD-CNH (Chinese Yuan) pair. Any major weakening in the Chinese yuan can have its negative impact on rupee. For USD-INR, 85.20 acts as a good base while 86.50 levels may be tested."

