Politics
History of Lok Sabha polls in numbers: More women in fray, fewer independent MPs

Summary
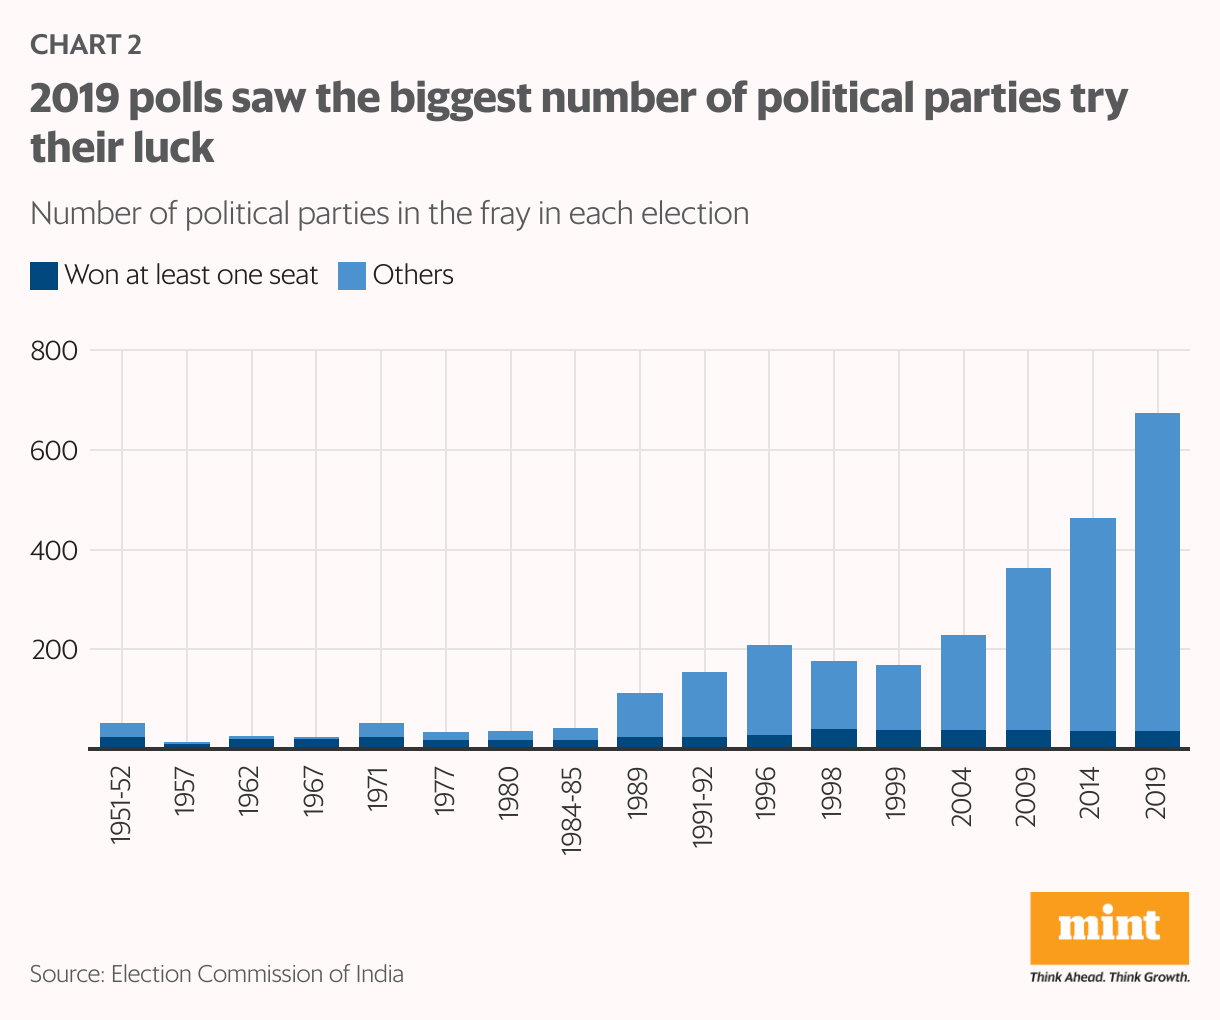
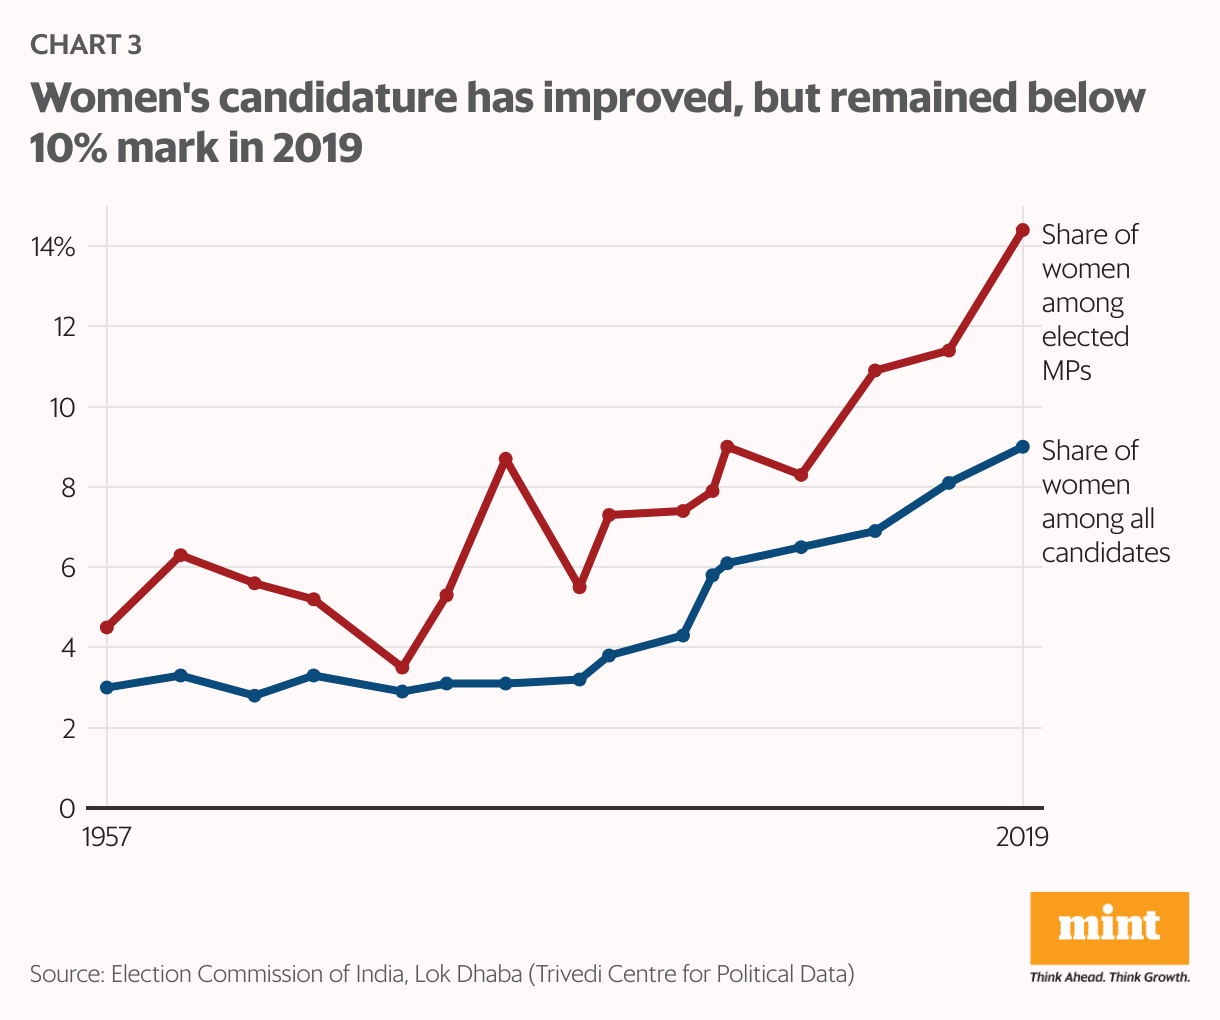
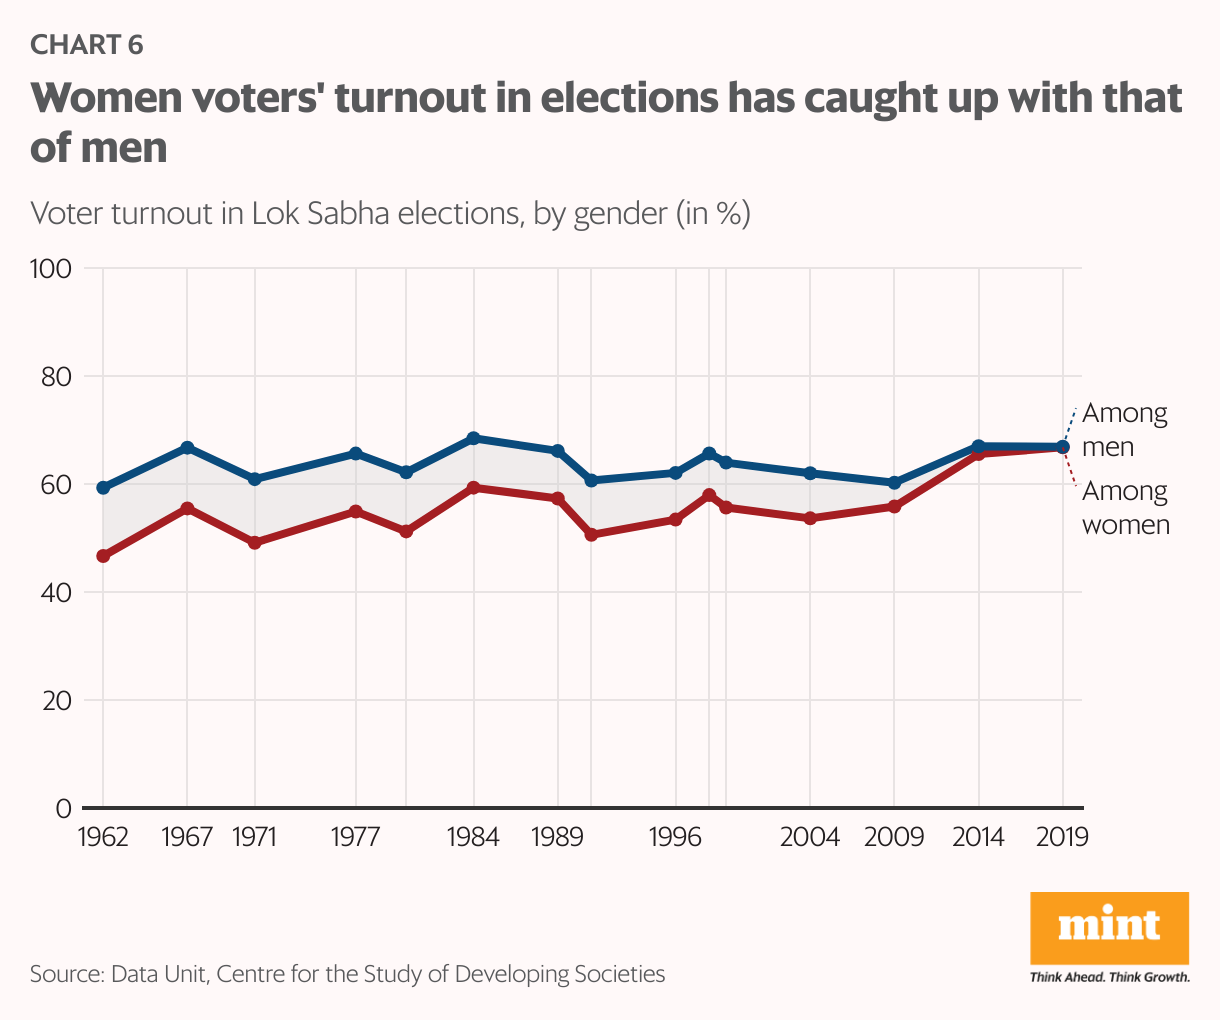
- The 2019 elections saw the highest ever number of political parties in the fray, and the voter turnout among women caught up with that of men.
Voters across India’s 543 parliamentary constituencies will cast their votes in the upcoming Lok Sabha elections, scheduled to be held between 19 April and 1 June. This is the second longest poll season ever, set to run for 44 days. The voter turnout amid the sweltering heat will be in focus, but data shows that Indians have increased their participation in elections over the years.
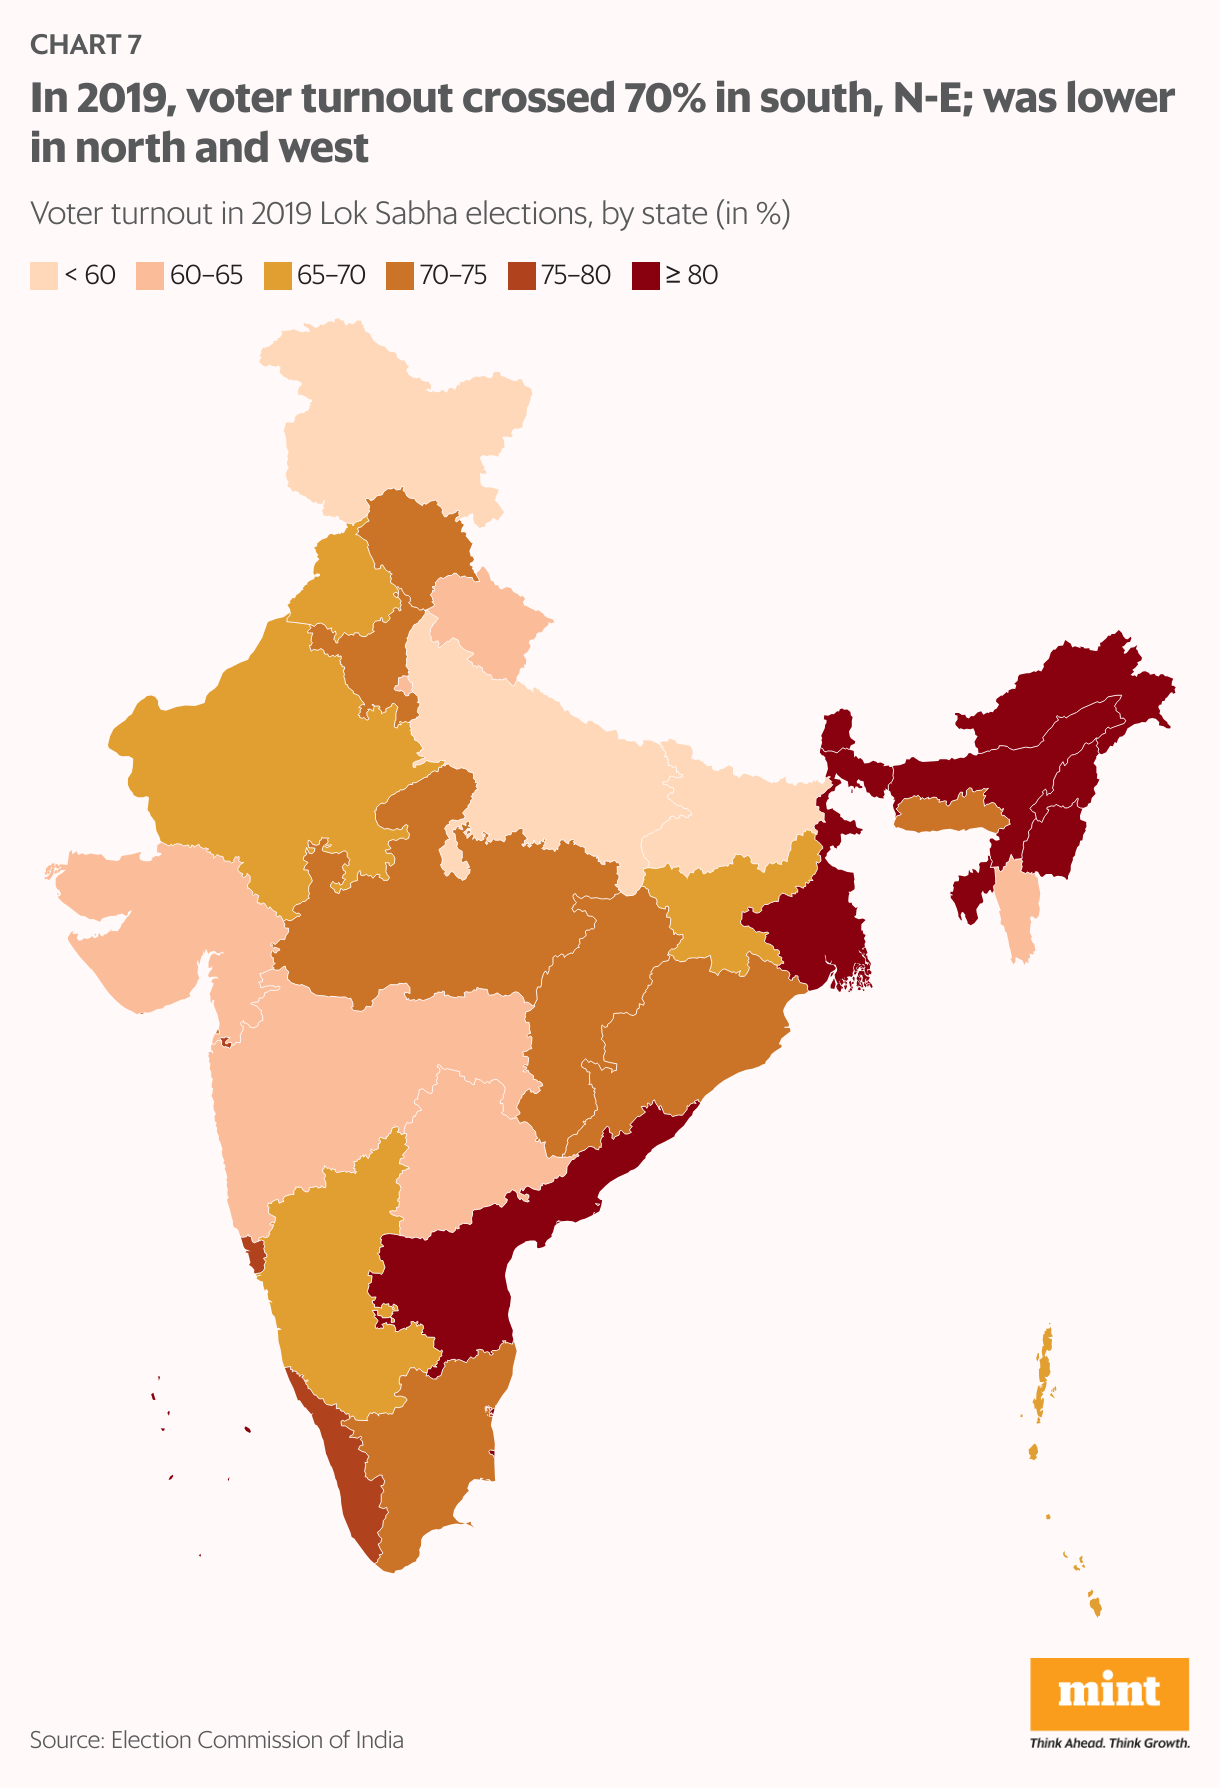
Several states in the south and north-east crossed 70% voter turnout in 2019. The turnout of women voters has, in particular, been on the rise, and caught up with the turnout of male voters in that election.
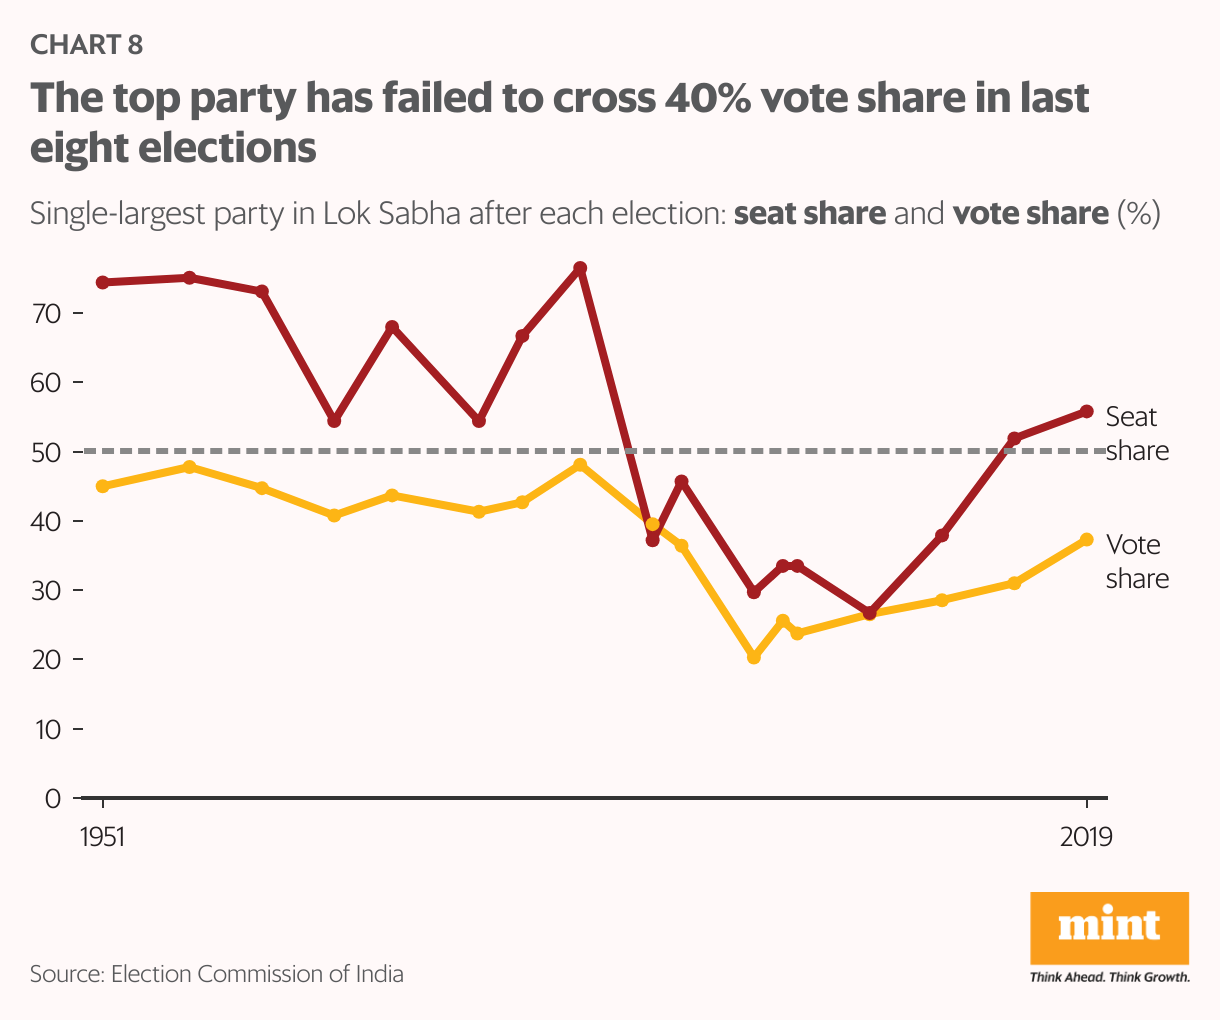
Another significant change in the past eight Lok Sabha elections has been the gap between the seat share and the vote share of the single largest party. This highlights the limitations of the first-past-the-post system and also reflects an increase in sharper contests. For example, in the 2019 elections, while the BJP won 56% of the seats, its vote share was just 37%—meaning 63% voters didn’t pick the party.
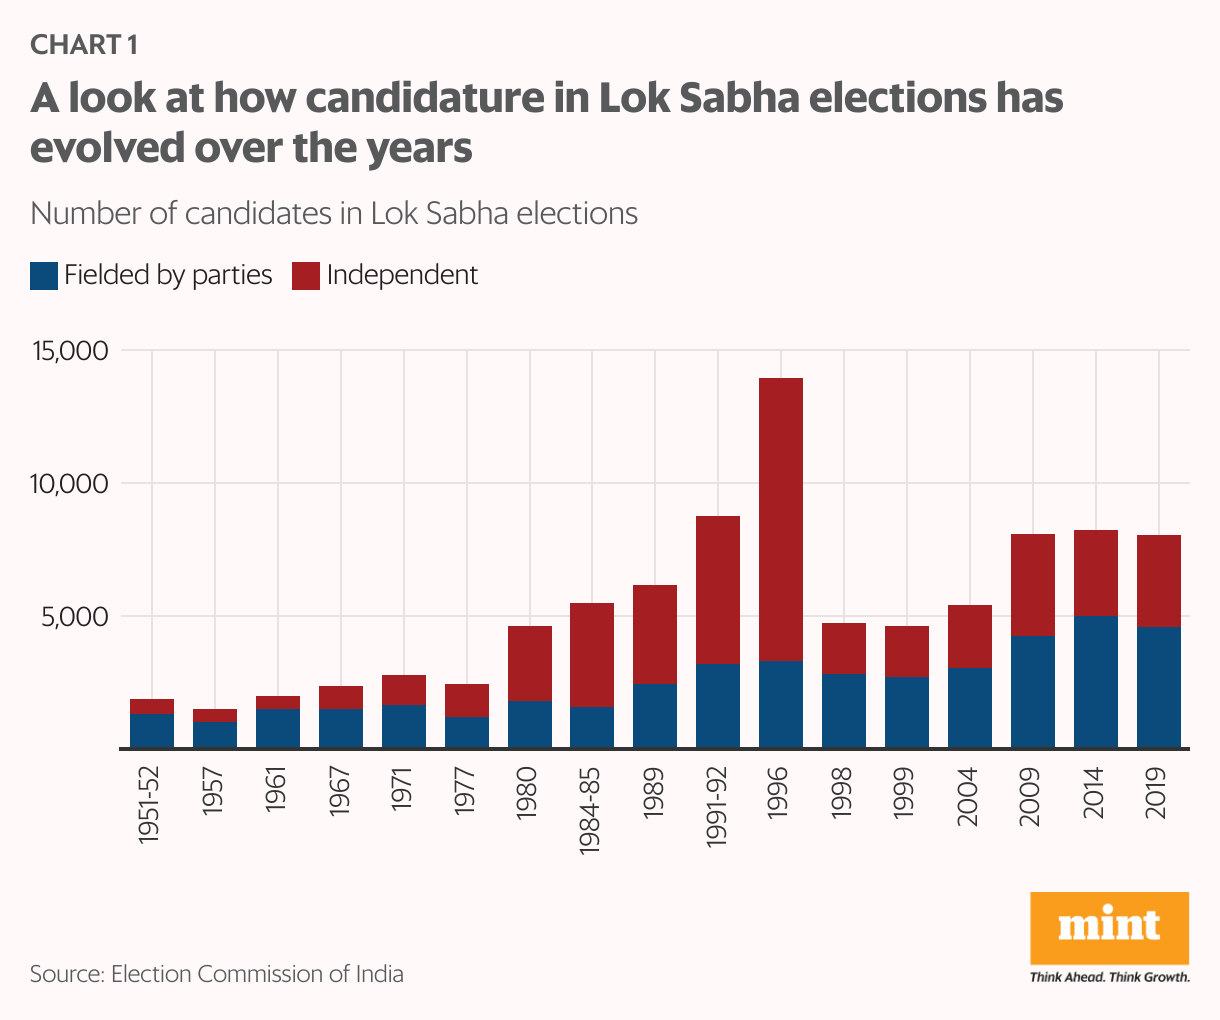
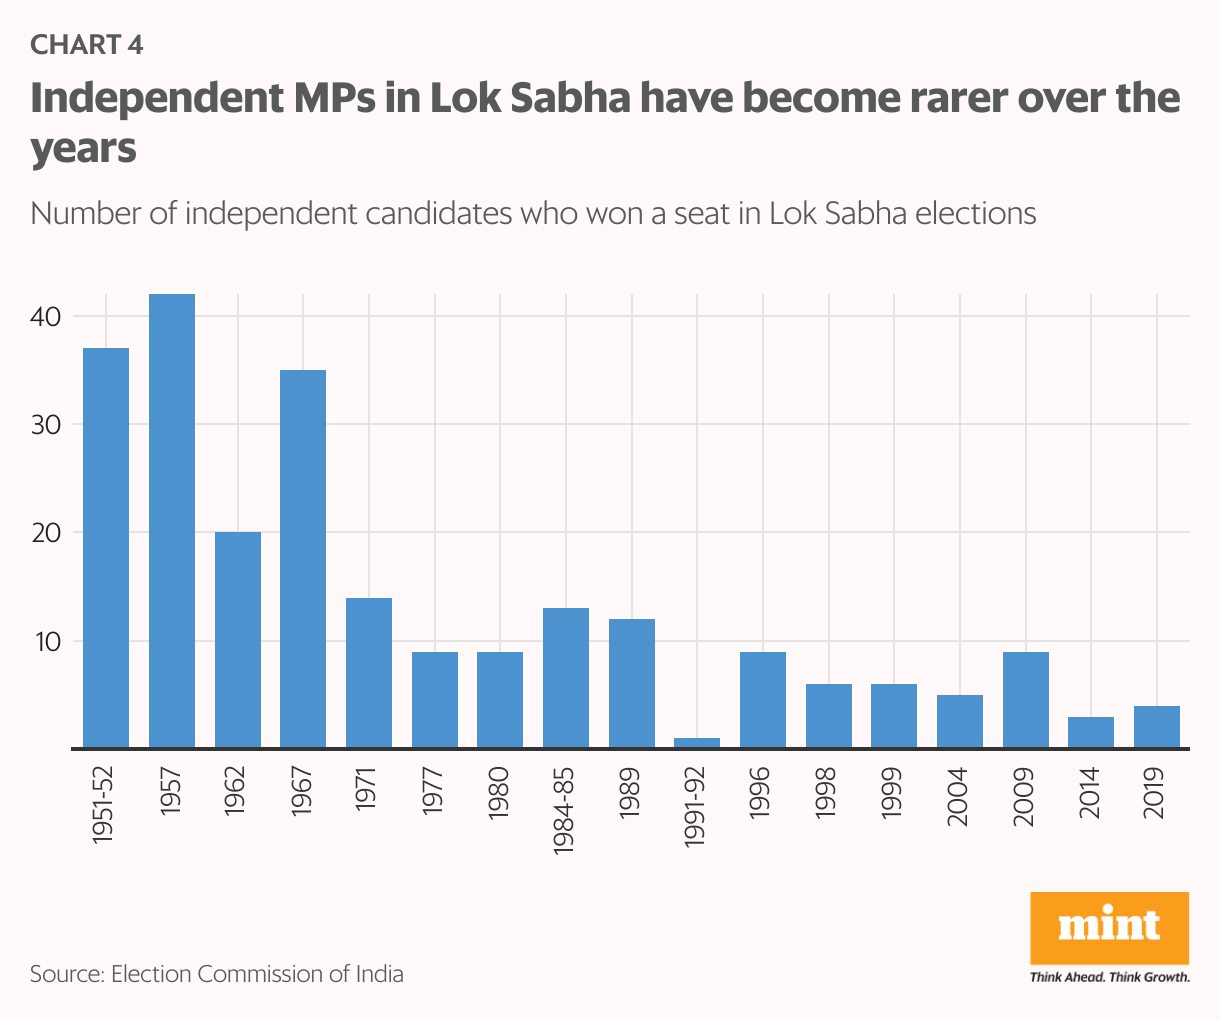
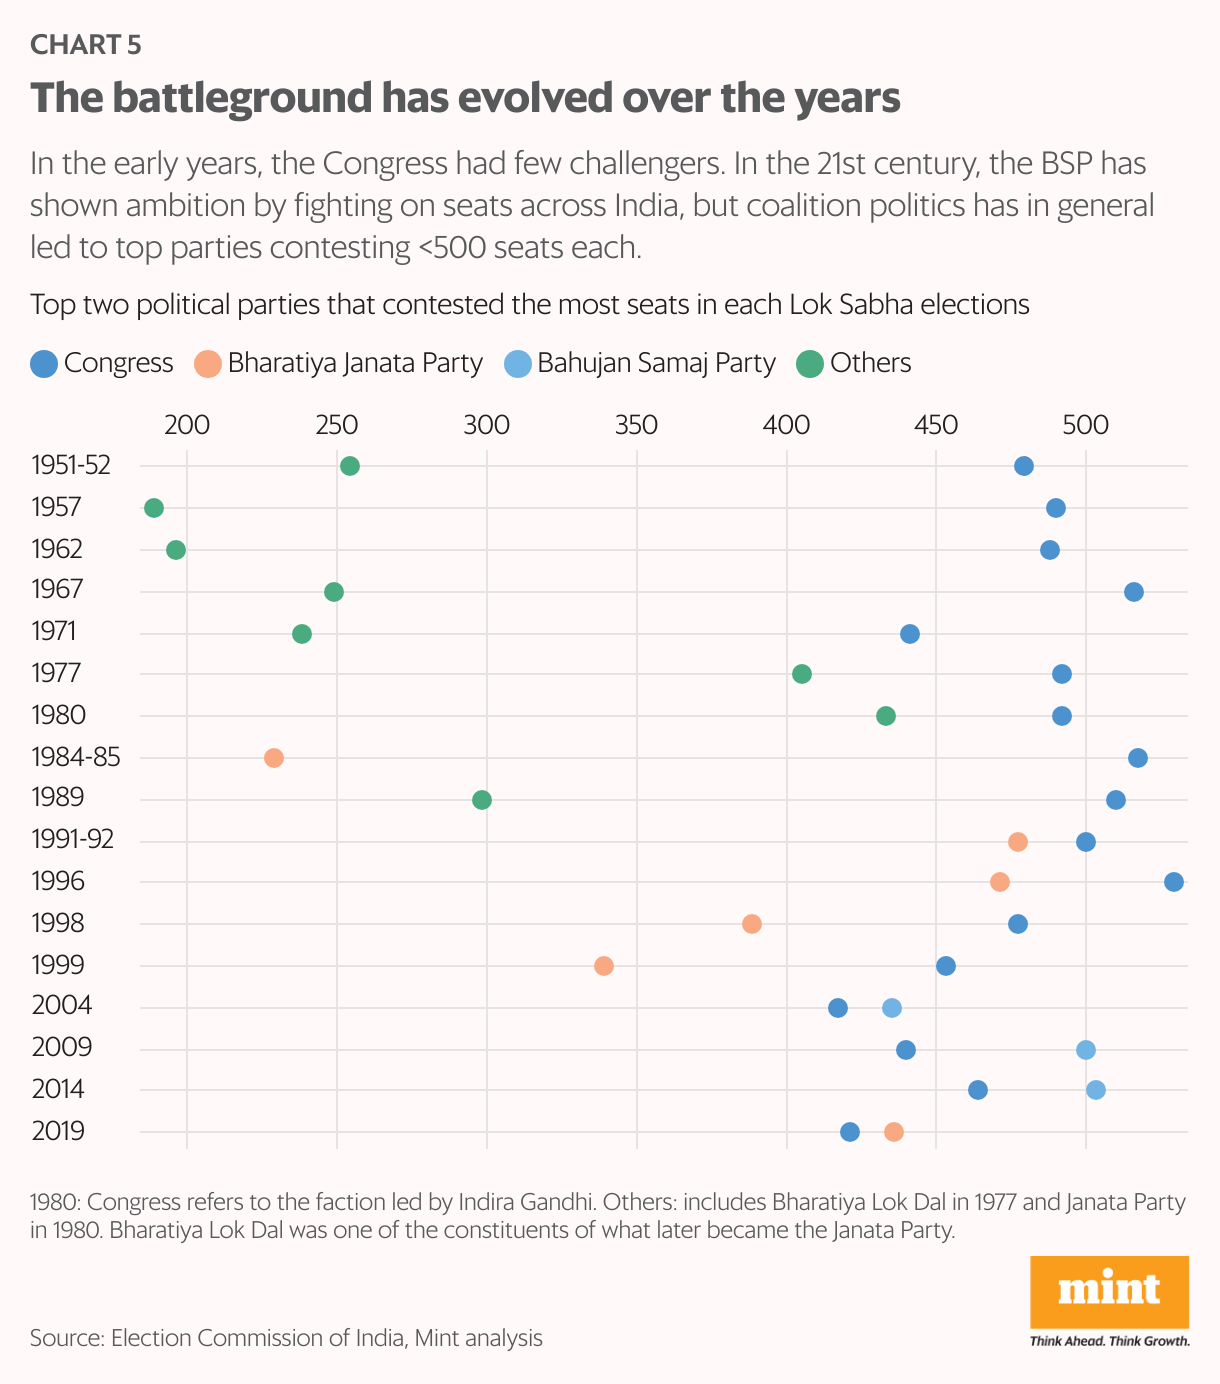
As the voters have evolved, so has the battleground. In the early years, the Congress’s dominance held strong but more parties are now trying their luck. The phenomenon of independent candidates winning elections has become feeble over the decades. Here’s a look at how the contenders and voters have shaped up since the 1950s, through numbers and charts.