 Economy
Indian economy’s report card moving away from the red: Mint tracker
")
Summary
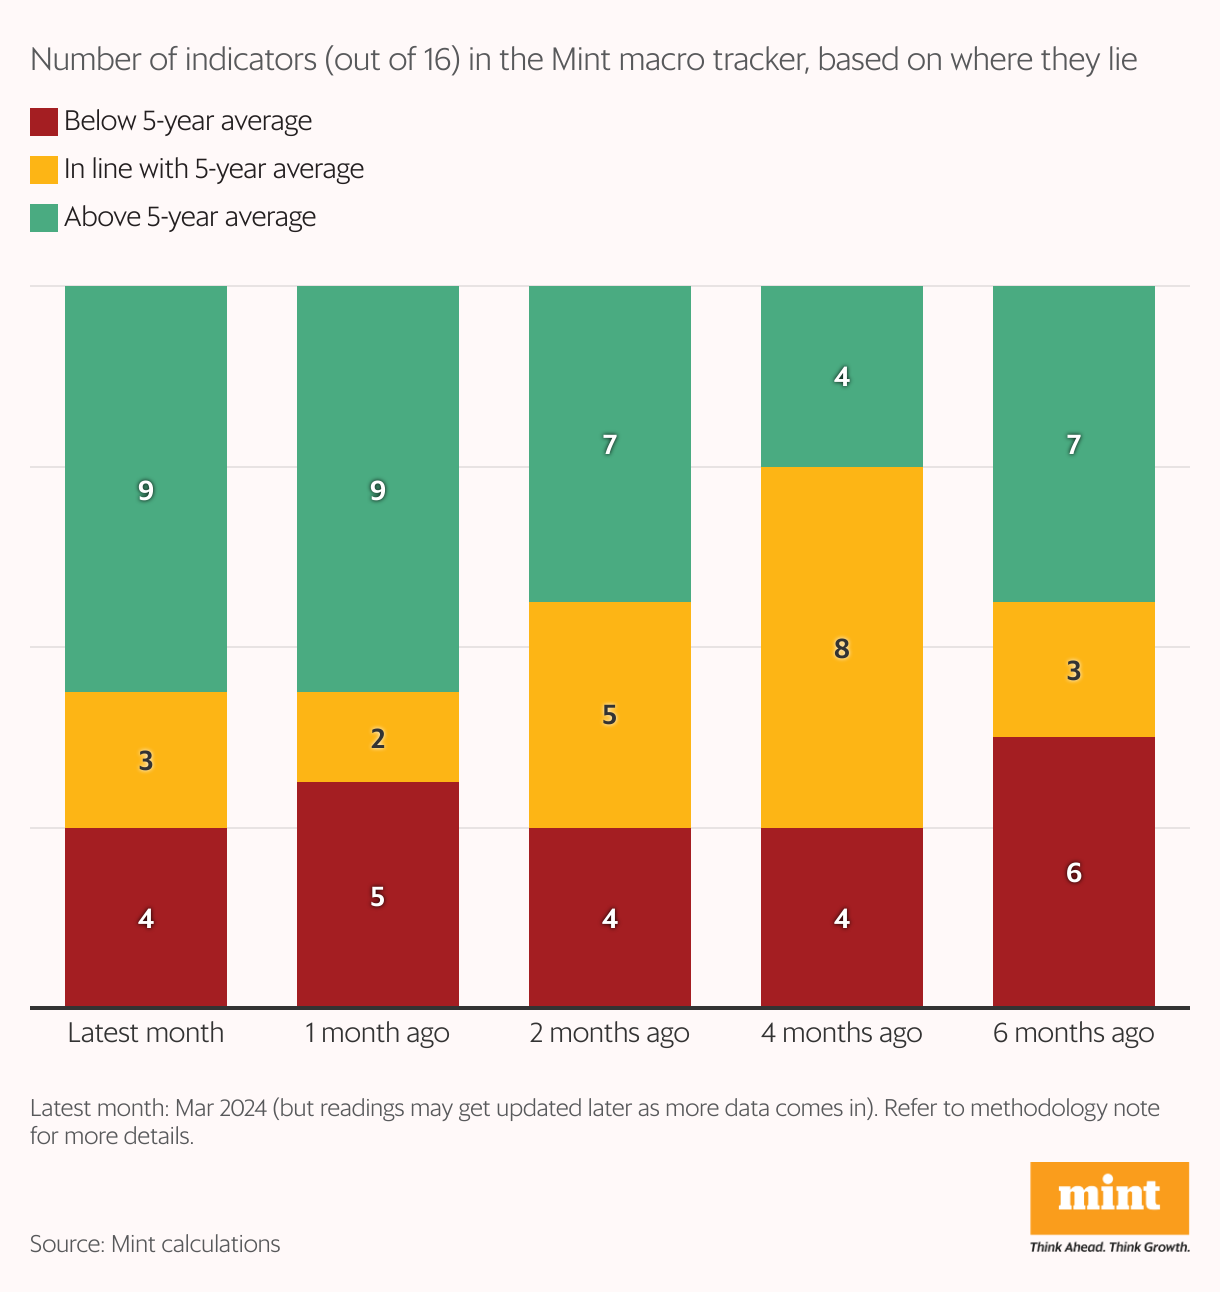
- As of March 2024, nine of the 16 high-frequency indicators tracked by us were in green, four in red, and three midway. That marks improvement from six months ago, when seven indicators were in green.
India’s economic performance showed slight improvement in March, with just four of the 16 high-frequency indicators tracked by Mint falling below their five-year average trend, as compared to five such indicators in February.
Nine indicators were in green, or above their five-year average trend—but the number of such indicators was unchanged since the previous month. The rest were in line with their average range.
These are the findings of the latest Mint macro tracker, which provides a monthly comprehensive report on the state of the economy, based on trends in 16 high-frequency indicators. The tracker has been running since October 2018.
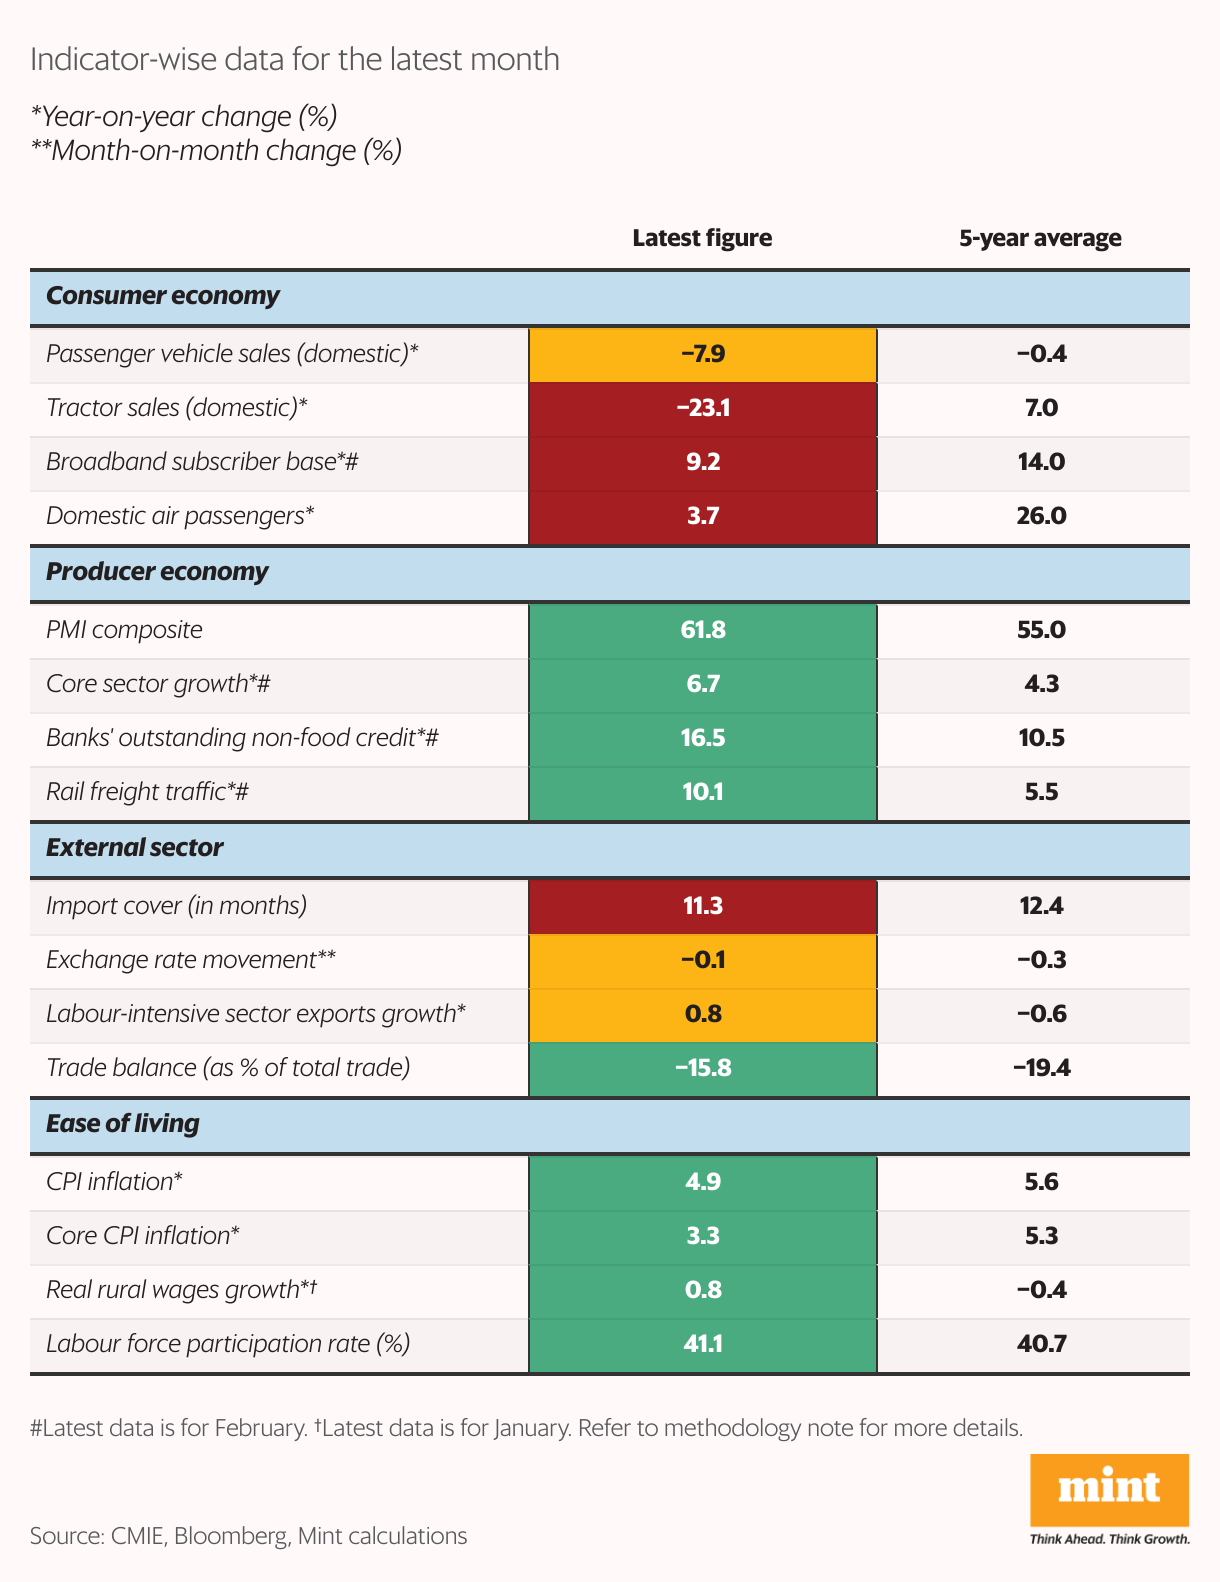
For each indicator, the value in each month is assigned a colour-coding (red, amber and green) to denote where it lies relative to the five-year average (red denotes worse, amber denotes it is in line with the average range, and green denotes better).
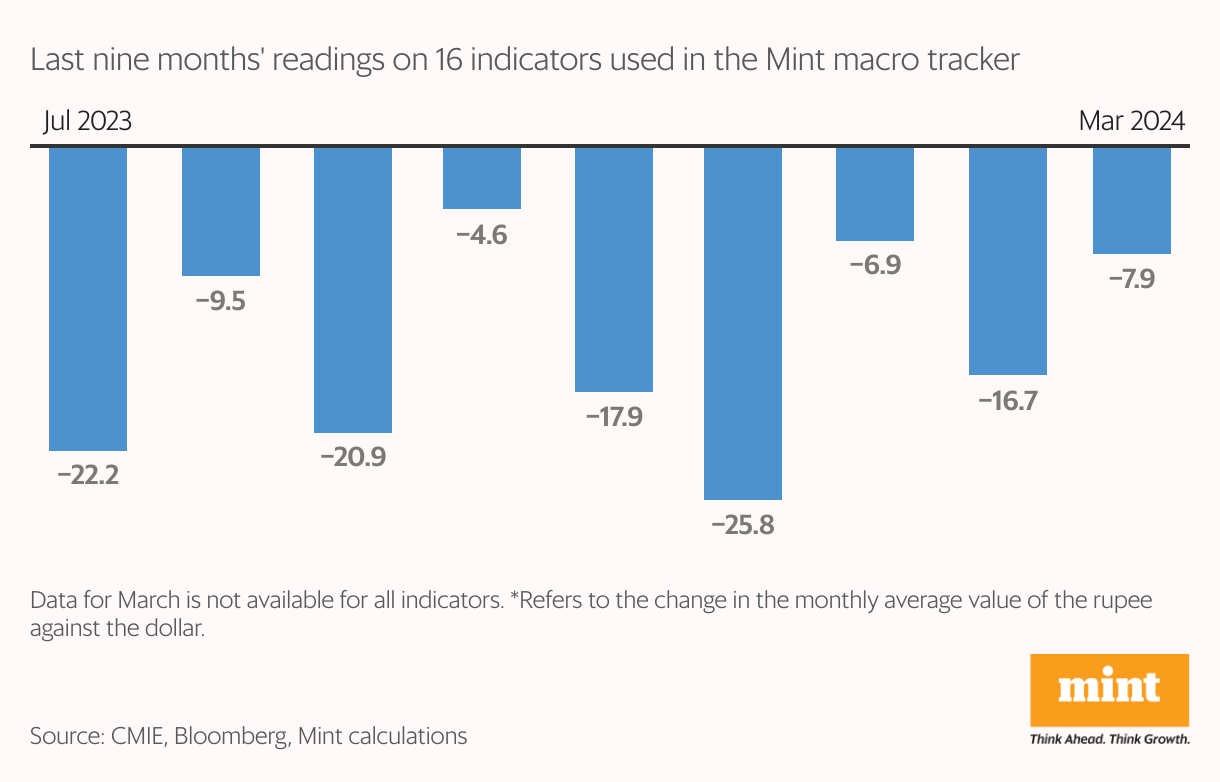
The improvement in March was led by passenger vehicle sales and India’s trade deficit: the former contracted less than in February, and the latter narrowed due to lower imports. However, a decline in the rupee against the US dollar proved to be a drag, as it moved from green to amber. The four indicators that stayed in the red were: domestic air passengers growth, import cover, tractor sales growth, and broadband subscribers growth.
The reading in March showed some improvement from six months ago (September 2023), when seven indicators were in green.
In another tracker run by Mint (Emerging Markets Tracker), India has maintained its position as the best-performing emerging market economy for three consecutive fiscal years.
Also read: India ends FY24 with a hat trick as No. 1 emerging market: Mint tracker
Methodology note: For each indicator, an average band is constructed around the five-year average value. This band's size varies by volatility (it depends on the standard deviation). An indicator that lies within this range is said to be 'in line with five-year average' (code: amber). Values falling below this range are said to be in red, and those lying above this range are said to be in green. For inflation, the red/green coding is reversed.
While calculating the five-year average, data for some indicators for April-May 2020 and April-May 2021 have been removed to eliminate lockdown-induced skews in the trend. However, the five-year averages may still show high figures due to sustained base effect in several indicators in 2021 and 2022.
Monthly standings will get updated retrospectively as more data comes in.


