 Economy
Mint tracker records slight dip in Indian economy’s performance in April
")
Summary
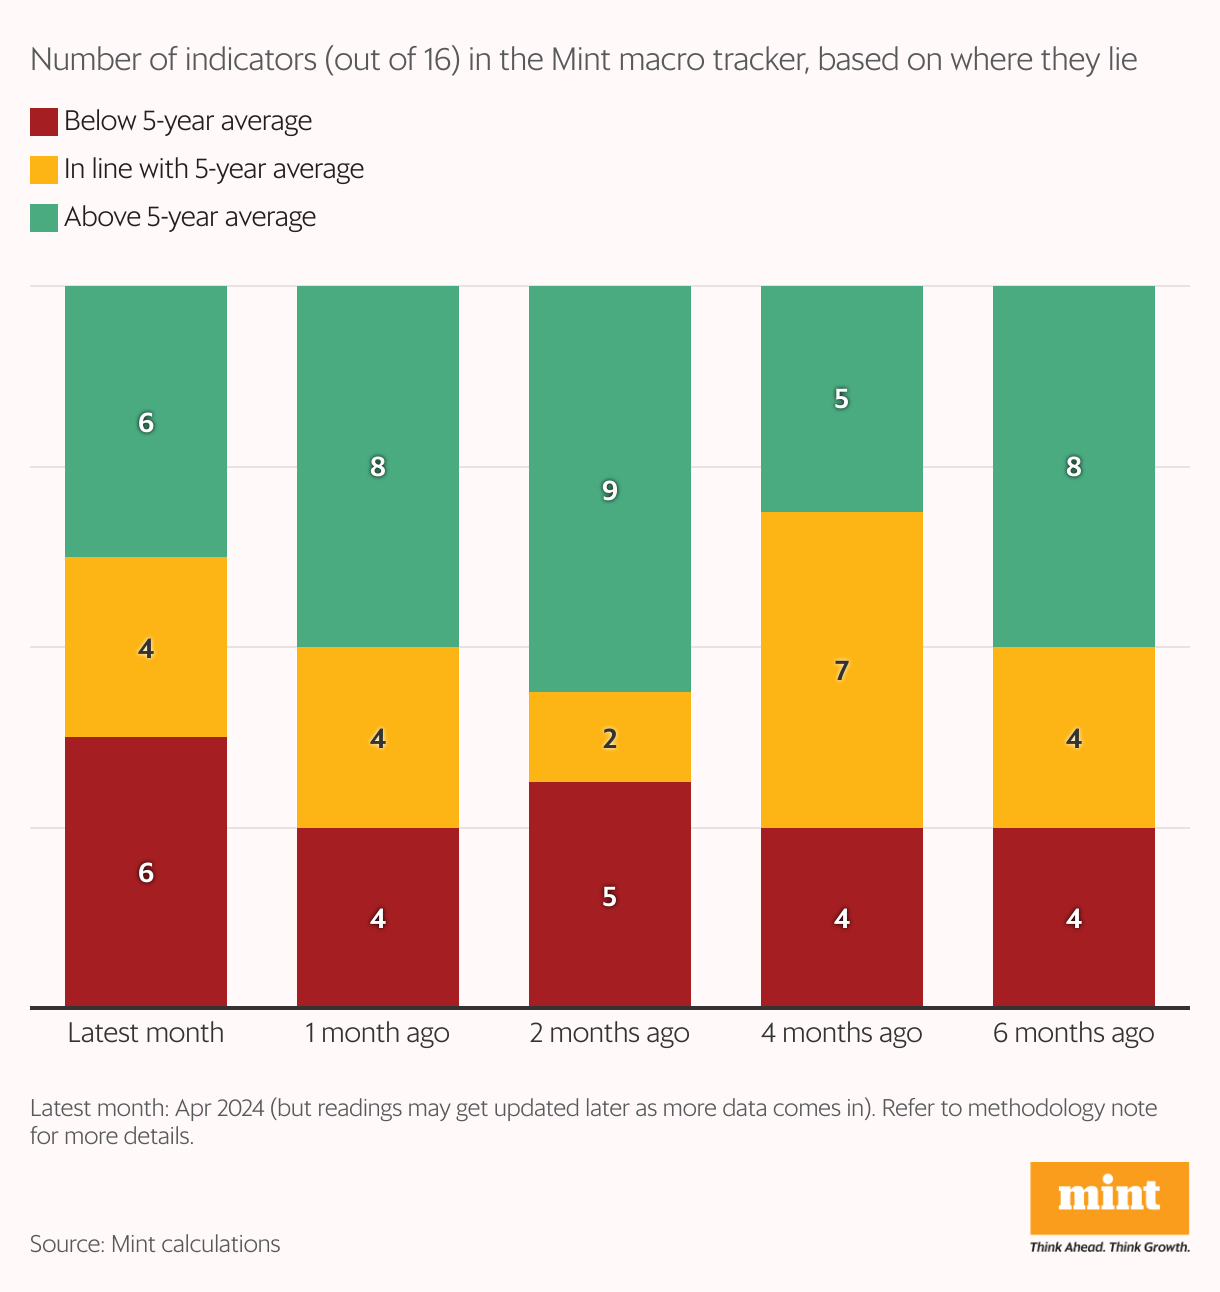
As of April 2024, six of the 16 indicators were in green, six in red, and four in the middle, which is a deterioration from last month, when eight indicators were in green.The Indian economy's performance moderated in April, with six of the 16 high-frequency indicators tracked by Mint falling below their five-year averages during the month, as against four in the previous month.
According to the latest update to Mint’s monthly macro tracker, six indicators were in green in April, that is, above their five-year averages. In March, eight of the indicators were in green.
The rest of the indicators were in line with their five-year average trends.
Also read: India begins FY25 on a strong note as top emerging market: Mint tracker
The readings have seen a deterioration over the past six months. However, the data for some indicators comes with a lag, and will be available only next month.
Also read: GDP grew 7.9% in FY24 despite slower January-March: Mint poll
Launched in October 2018, Mint’s macro tracker provides a monthly comprehensive report on the state of the economy, based on trends in 16 high-frequency indicators. For each indicator, the value in each month is assigned a colour-coding (red, amber and green) to denote where it lies relative to the five-year average (worse, in line, or better).
Also read: After a long exports downturn, what lies next?
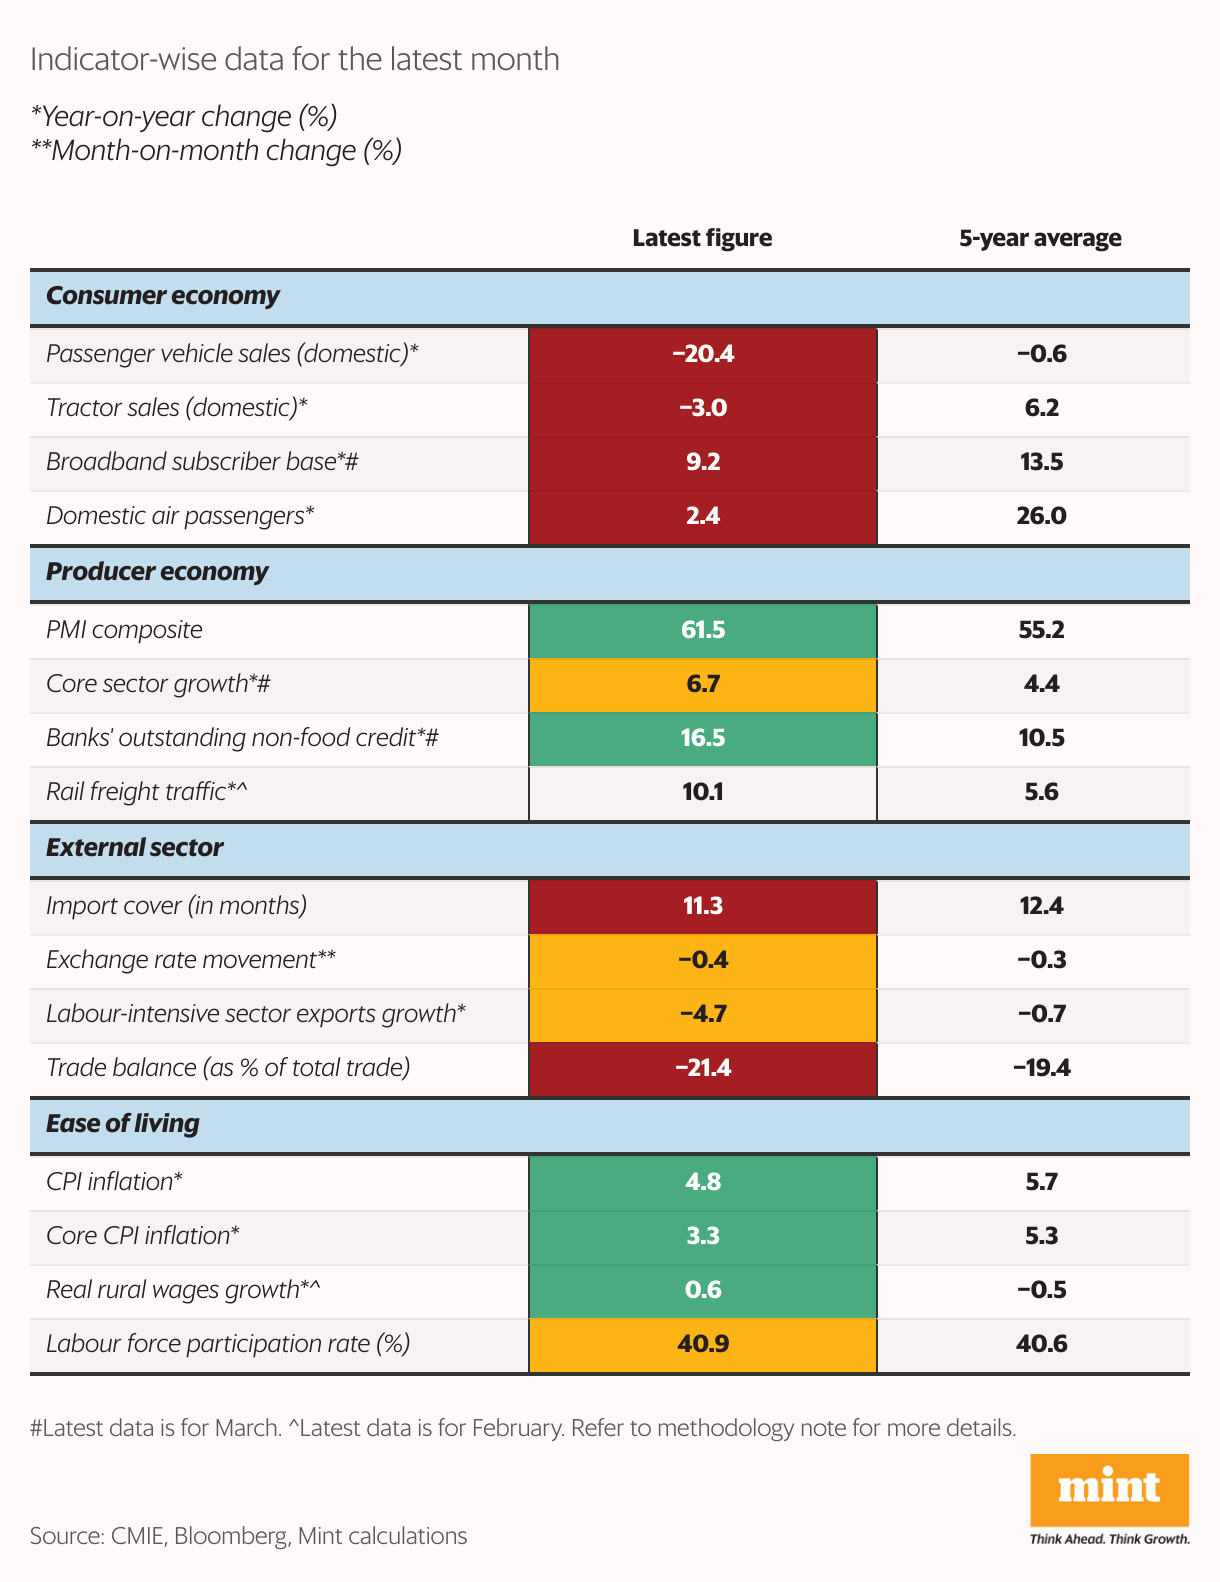
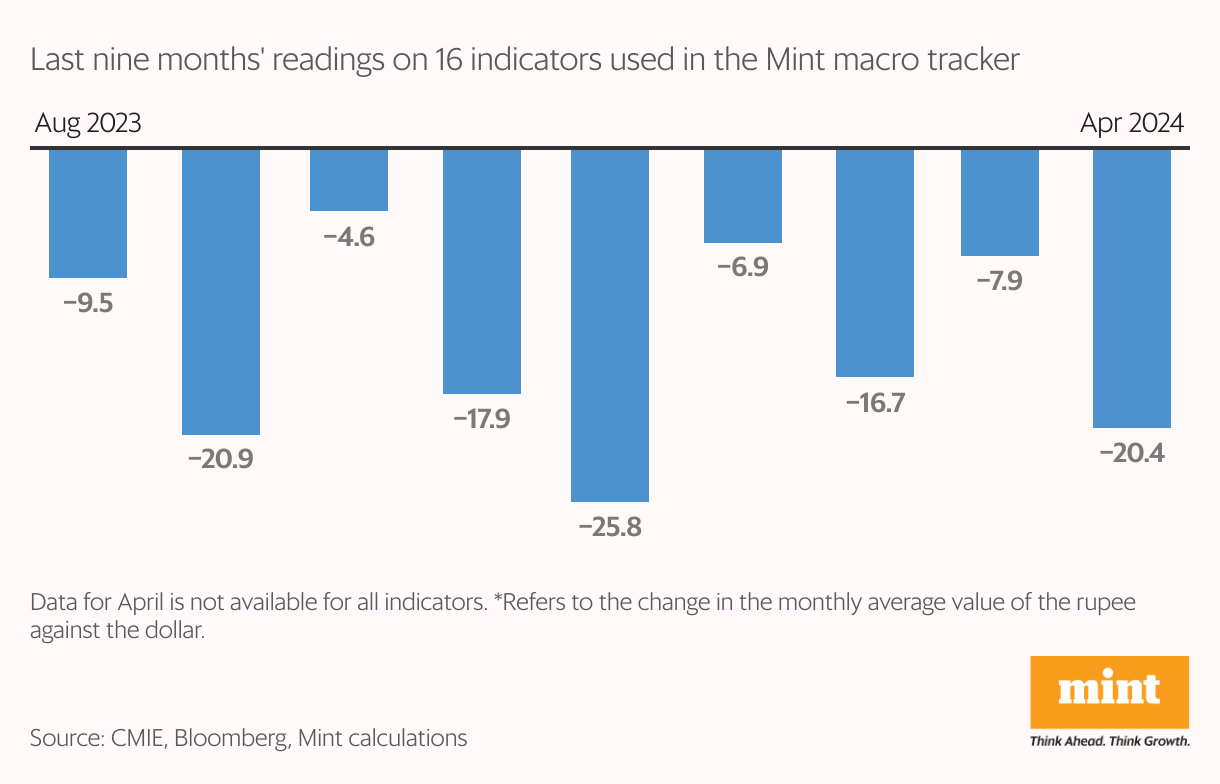
The deterioration in April was primarily driven by the widening trade deficit, which was at a five-month high. Domestic passenger car sales continued to be a drag as the indicator moved from amber to red. Three indicators—tractor sales, air passenger traffic, and import cover—continued to be in the red.
Methodology note: While calculating the five-year average, data for some indicators for April-May 2020 and April-May 2021 have been removed to eliminate lockdown-induced skews in the trend. However, the five-year averages may still show high figures due to sustained base effect in several indicators in 2021 and 2022.
Monthly standings will get updated retrospectively as more data comes in.
For inflation, the red/green coding is reversed.


